Published
4 years ago on
December 30, 2019
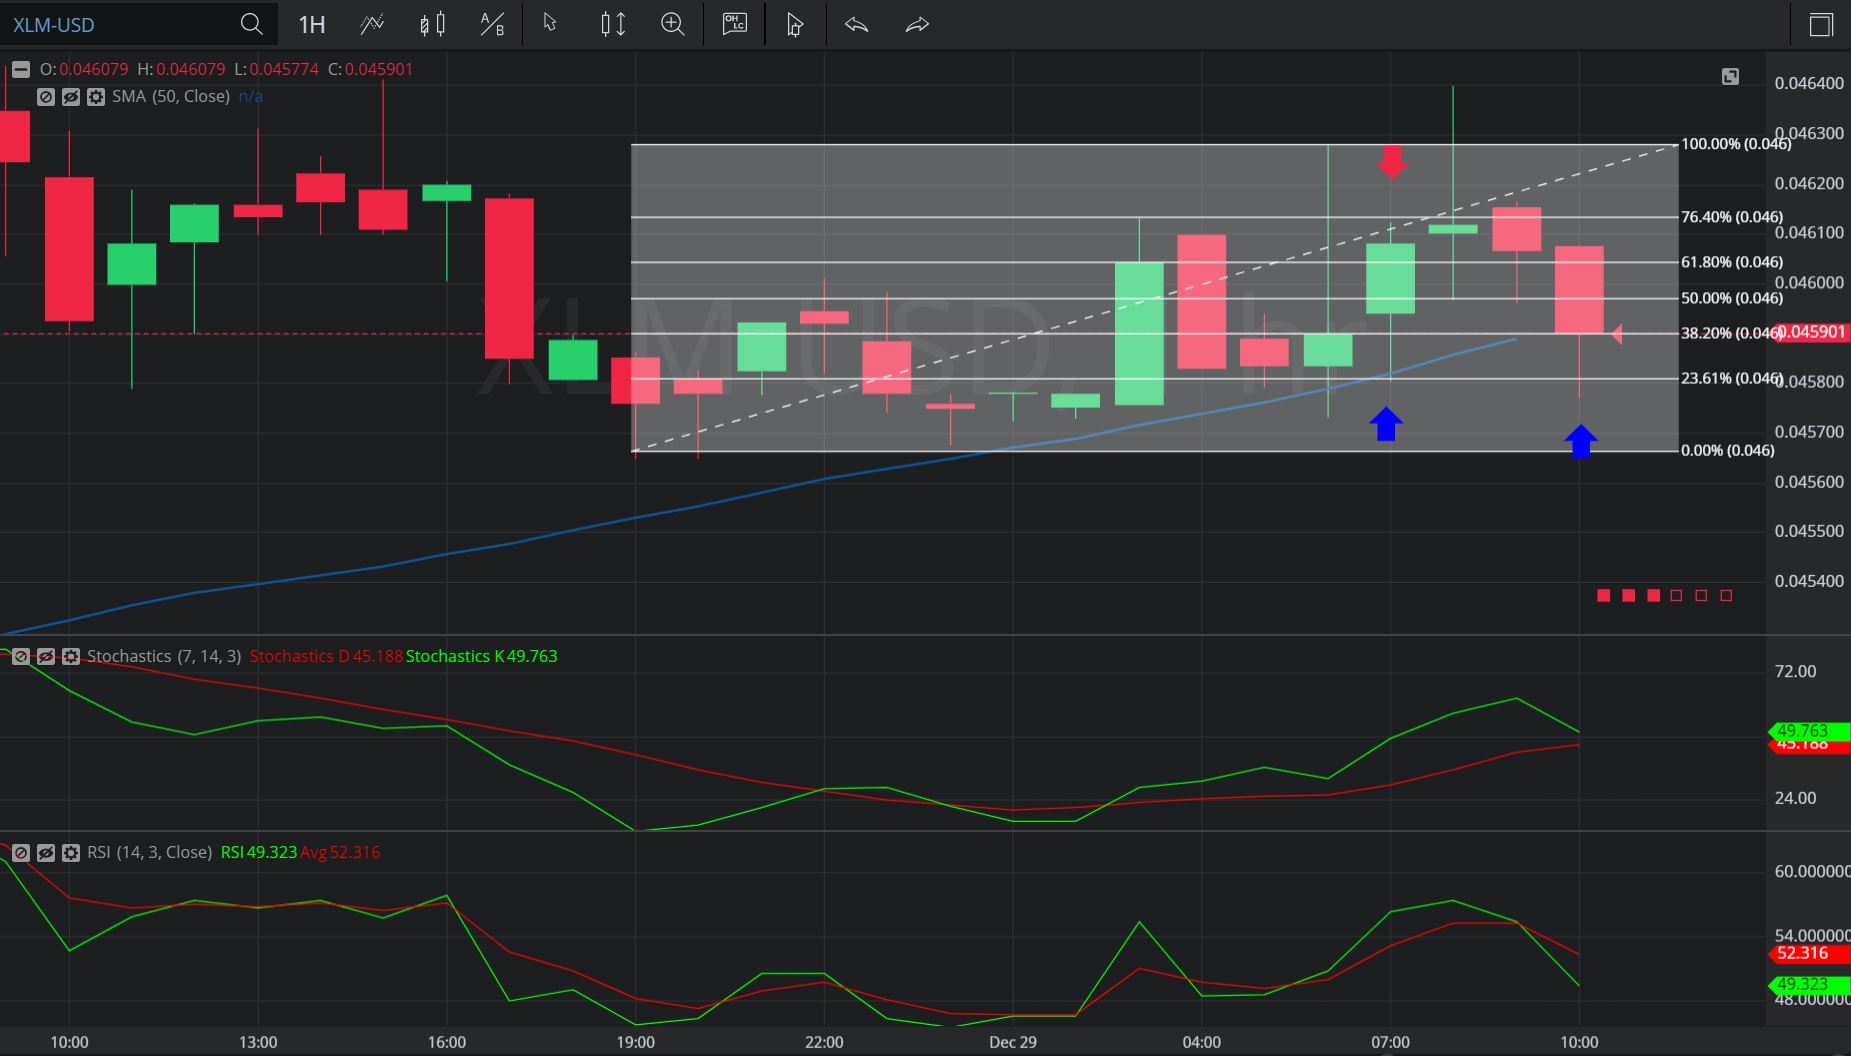
In this Hourly chart of Stellar/ US dollar (XLM/ USD), there is an appreciating range from 0.045649 to 0.046282.
We can observe that the market then depreciated to the 0.045807 area (identified by the blue up arrow), right around the 0.0457983 area that represents the 76.4% retracement of the appreciating range.
The move lower to the 0.045807 area was also right around the 50-bar MA (hourly).
We can observe the market then appreciated to the 0.046401 area and then depreciated to the 0.045774 area (identified by the second blue up arrow), just below the 0.0457983 area that represents the 76.4% retracement of the appreciating range.
The market then appreciated further.
Using RSI, we can observe that the slope of both RSI (14) and RSI Average (3) continued to positively increase after the market traded as low as 0.045807, indicating probable price appreciation. RSI (14) has since bearishly moved below RSI Average (3), indicating a probable pullback in price.
Using Slow Stochastics, we can observe that the slope of both Stochastics K and Stochastics D positively increased after the market traded as low as 0.045807, indicating probable price appreciation. The slope of Stochastics K has since turned negative and Stochastics K is converging with Stochastics D, suggesting a possible slowdown in price appreciation.
Stay on top of the cryptocurrency market with CryptoDaily’s trading charts!
https://charts.cryptodaily.net/
Investment Disclaimer