Published
4 years ago on
December 07, 2019
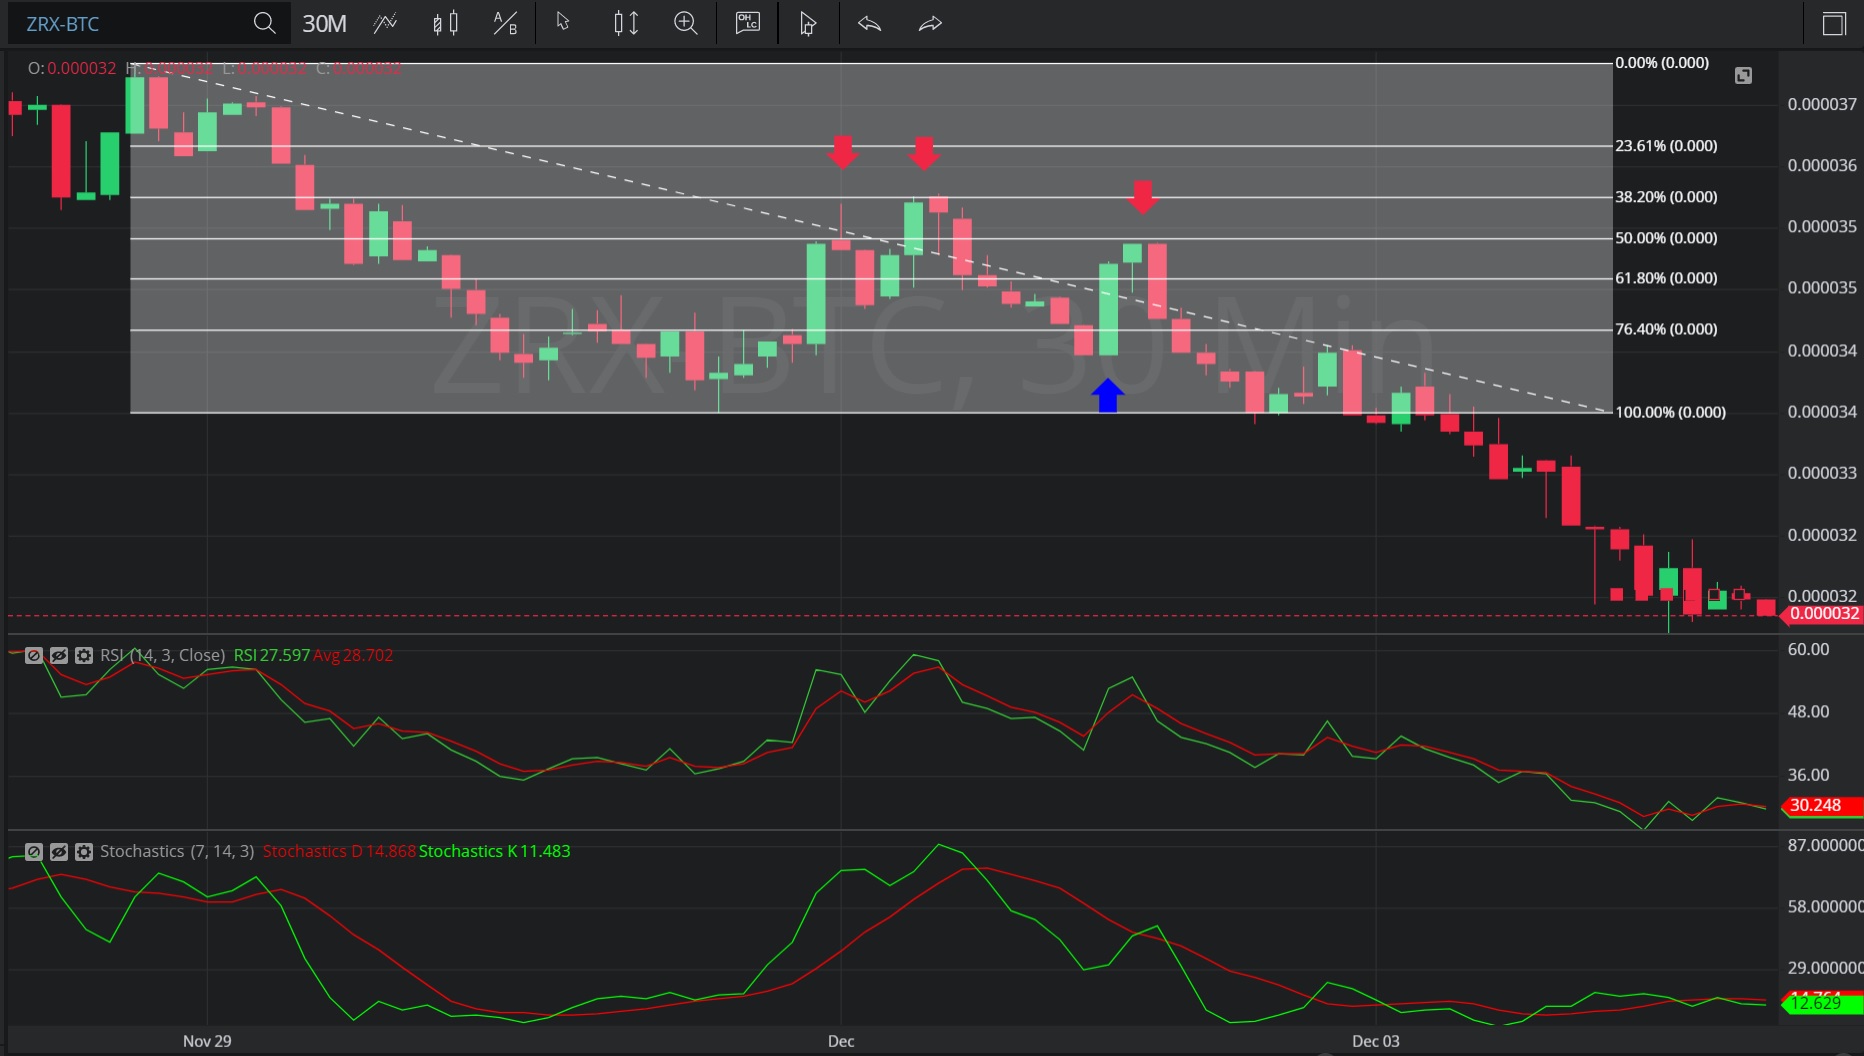
In this 30-minute chart of 0x/ Bitcoin (ZRX/ BTC), there is a depreciating range from 0.000037 to 0.000034.
We can see that after the depreciation, the market appreciated to the 0.000036 level (indicated by the two red down arrows), just above the 0.000035854 level that represents the 61.8% retracement of the depreciation.
The market then depreciated to the 0.000034 level (identified by the blue up arrow), below the 0.000034708 level that represents the 23.6% retracement of the depreciating range.
The pair then appreciated to the 0.000035 level (identified by the third red down arrow), just below the 0.0000355 level that represents the 50% retracement of the depreciating range.
We can see the pair then depreciated sharply.
Using RSI, we can observe long periods where RSI Average (3) was greater than RSI (14), coinciding with the pair’s steady depreciation. We can also see extended periods where the slope of RSI Average (3) and RSI (14) were negative. There is currently divergence between RSI Average (3) and RSI (14), indicating possible further depreciation.
Using Slow Stochastics, we can see the slope of Stochastics D turned negative after the appreciation to 0.000036 and we can see three instances when Stochastics D bearishly crossed above Stochastics K, coinciding with market depreciation. There is currently divergence between Stochastics D and Stochastics K, indicating possible further depreciation.
Stay on top of the cryptocurrency market with CryptoDaily’s trading charts!
https://charts.cryptodaily.net/
Investment Disclaimer