Published
4 years ago on
January 11, 2020
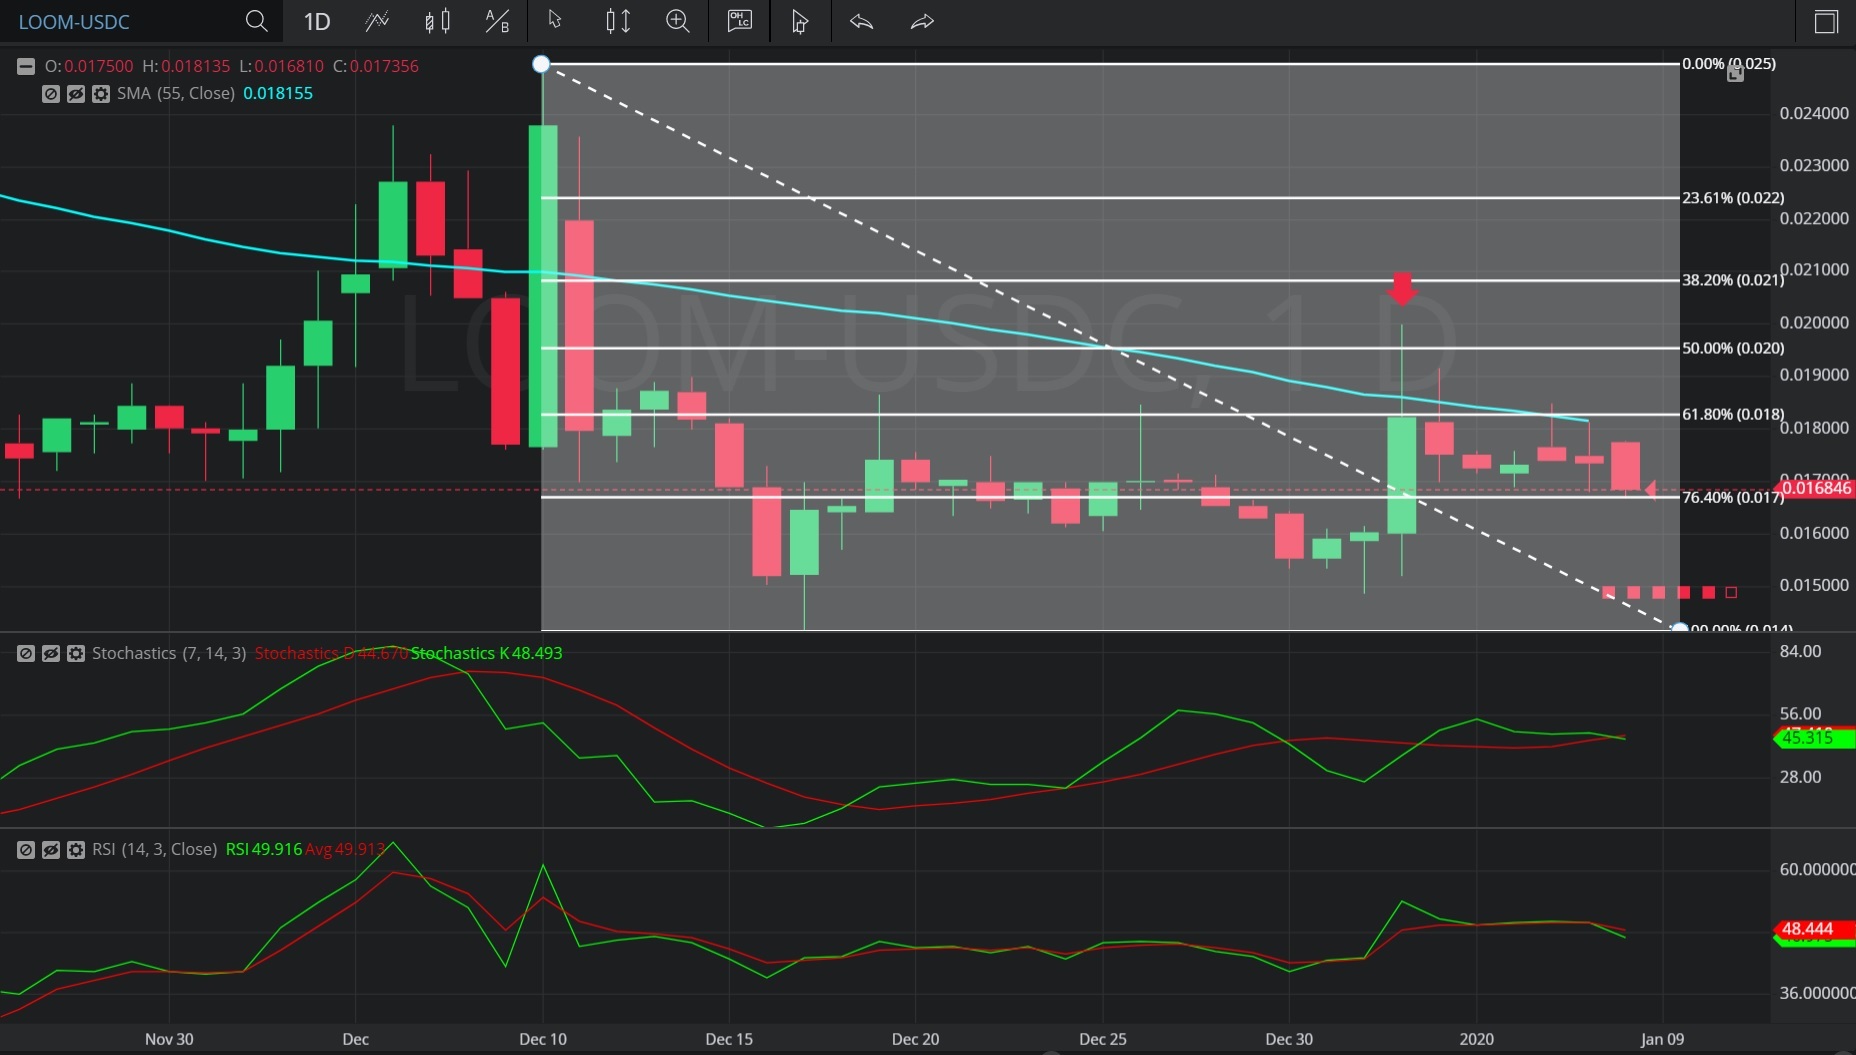
In this Daily chart of Loom Network/ US dollar Coin (LOOM/ USDC), there is a depreciating range from 0.025 to 0.014193.
We can observe that the market then appreciated to the 0.02 level (identified by the red down arrow), just above the 0.0195965 level that represents the 50.0% retracement of the depreciating range.
We can observe that the 0.02 level was just above the 0.018591 level, the area where the 55-bar Simple Moving Average was indicating at the time.
The market then depreciated to the 0.0167 level.
Using RSI, we can observe that the slope of RSI (14) turned negative after the market traded as high as the 0.02 level, and that RSI Average (3) bearishly crossed above RSI (14) thereafter. RSI Average (3) continues to indicate above RSI (14) and both RSI Average (3) and RSI (14) have negative slopes, suggesting continued price depreciation is likely.
Using Slow Stochastics, we can observe that the slope of Stochastics K bearishly turned negative after the market traded as high as 0.02. We can also observe that Stochastics D has just bearishly crossed above Stochastics K, suggesting continued price depreciation is likely.
Stay on top of the cryptocurrency market with CryptoDaily’s trading charts!
https://charts.cryptodaily.net/
Investment Disclaimer