Published
4 years ago on
January 19, 2020
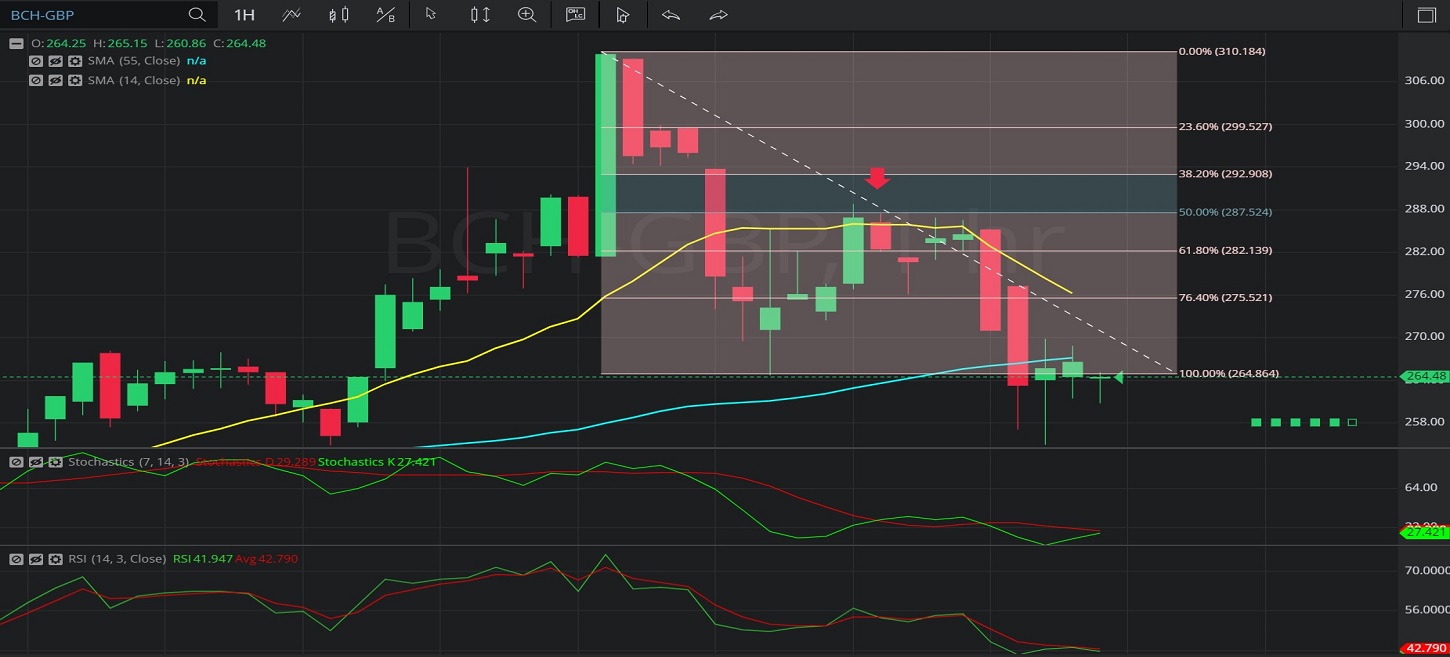
In this Hourly chart of Bitcoin Cash / British pound (BCH/ GBP), there is a depreciating range from 310.12 to 264.74.
We can observe that the market then appreciated to the 288.84 level (identified by the red down arrow), just above the 287.43 level that represents the 50% retracement of the depreciating range.
These levels were also close to the 14-bar Simple Moving Average (identified in yellow), indicating around the 285.95 level.
We can observe that the market then depreciated to the 255.00 level, below the 55-bar Simple Moving Average (identified in blue), indicating around the 266.34 area.
Using RSI, we can observe that the slope of RSI (14) and the slope of RSI Average (3) turned negative after the market traded as high as the 288.84 level, and that RSI Average (3) bearishly moved above RSI (14). RSI (14) moved above and below RSI Average (3) a few times and RSI Average (3) remains above RSI (14), indicating possible price depreciation.
Using Slow Stochastics, we can observe that the slope of Stochastics K and the slope of Stochastics D turned negative after the market traded as high as the 288.84 level. Even though Stochastics K moved back above Stochastics D, Stochastics K is indicating below Stochastics D now, indicating possible price depreciation.
Stay on top of the cryptocurrency market with CryptoDaily’s trading charts!
https://charts.cryptodaily.net/
Investment Disclaimer