Published
4 years ago on
January 05, 2020
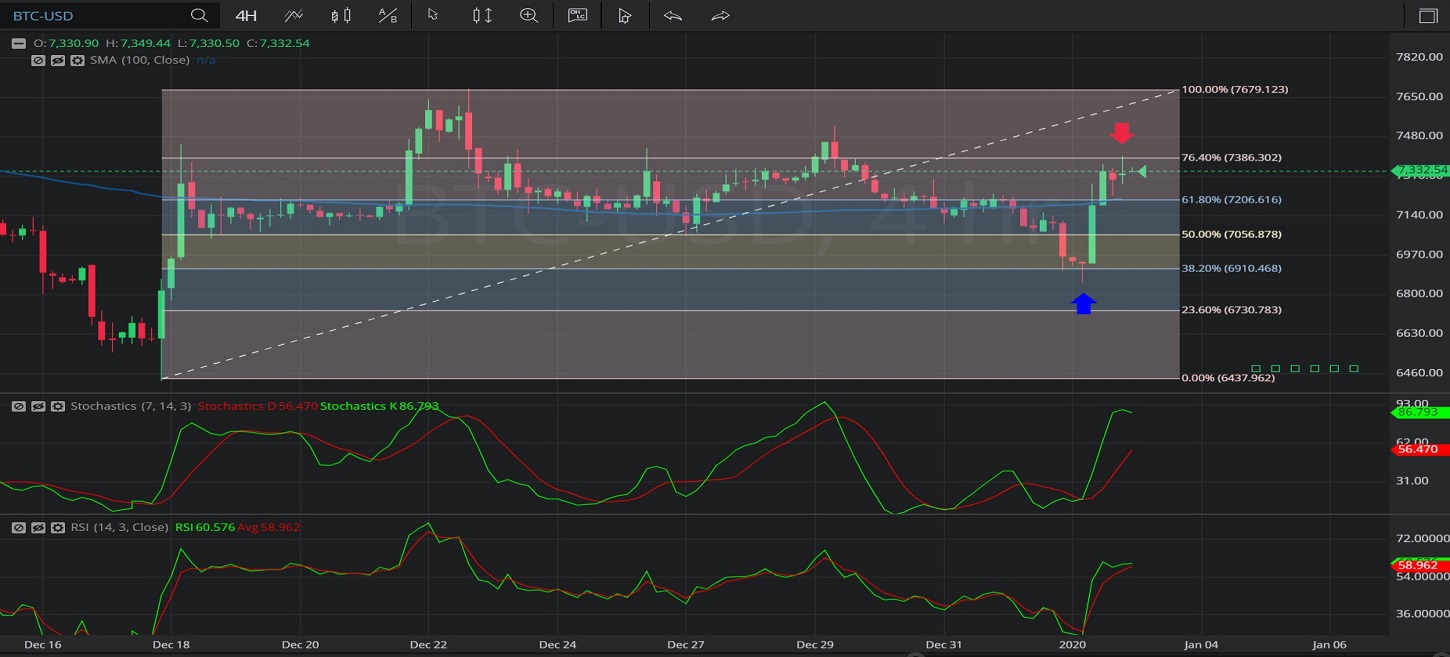
In this 4-hourly chart of Bitcoin/ United States dollar (BTC/ USD), there is an appreciating range from 6430.00 to 7688.99.
We can observe that the market then depreciated to the 6854.67 level (identified by the blue up arrow), just below the 6910.93 level that represents the 61.8% retracement of the appreciating range.
The market then appreciated to the 7401.20 level (identified by the red down arrow), just above the 7391.86 level that represents the 23.6% retracement of the appreciating range.
We can also observe that the market moved above the 100-bar Simple Moving Average, then indicating around the 7213.48 area.
The market appears to be continuing to appreciate.
Using RSI, we can observe that the slopes of both RSI (14) and RSI Average (3) turned positive after the market traded as low as 6854.67. We can also observe that RSI (14) bullishly moved above RSI Average (3) after the market traded as low as 6854.67, and that RSI (14) remains above RSI Average (3). This is indicative of continued price appreciation.
Using Slow Stochastics, we can observe that the slopes of both Stochastics K and Stochastics D turned positive after the market traded as low as 6854.67, and that Stochastics K bullishly crossed above Stochastics D after the market traded as low as 6854.67. Stochastics K remains above Stochastics D, and this suggests continued price appreciation.
Stay on top of the cryptocurrency market with CryptoDaily’s trading charts!
https://charts.cryptodaily.net/
Investment Disclaimer