Published
4 years ago on
February 01, 2020
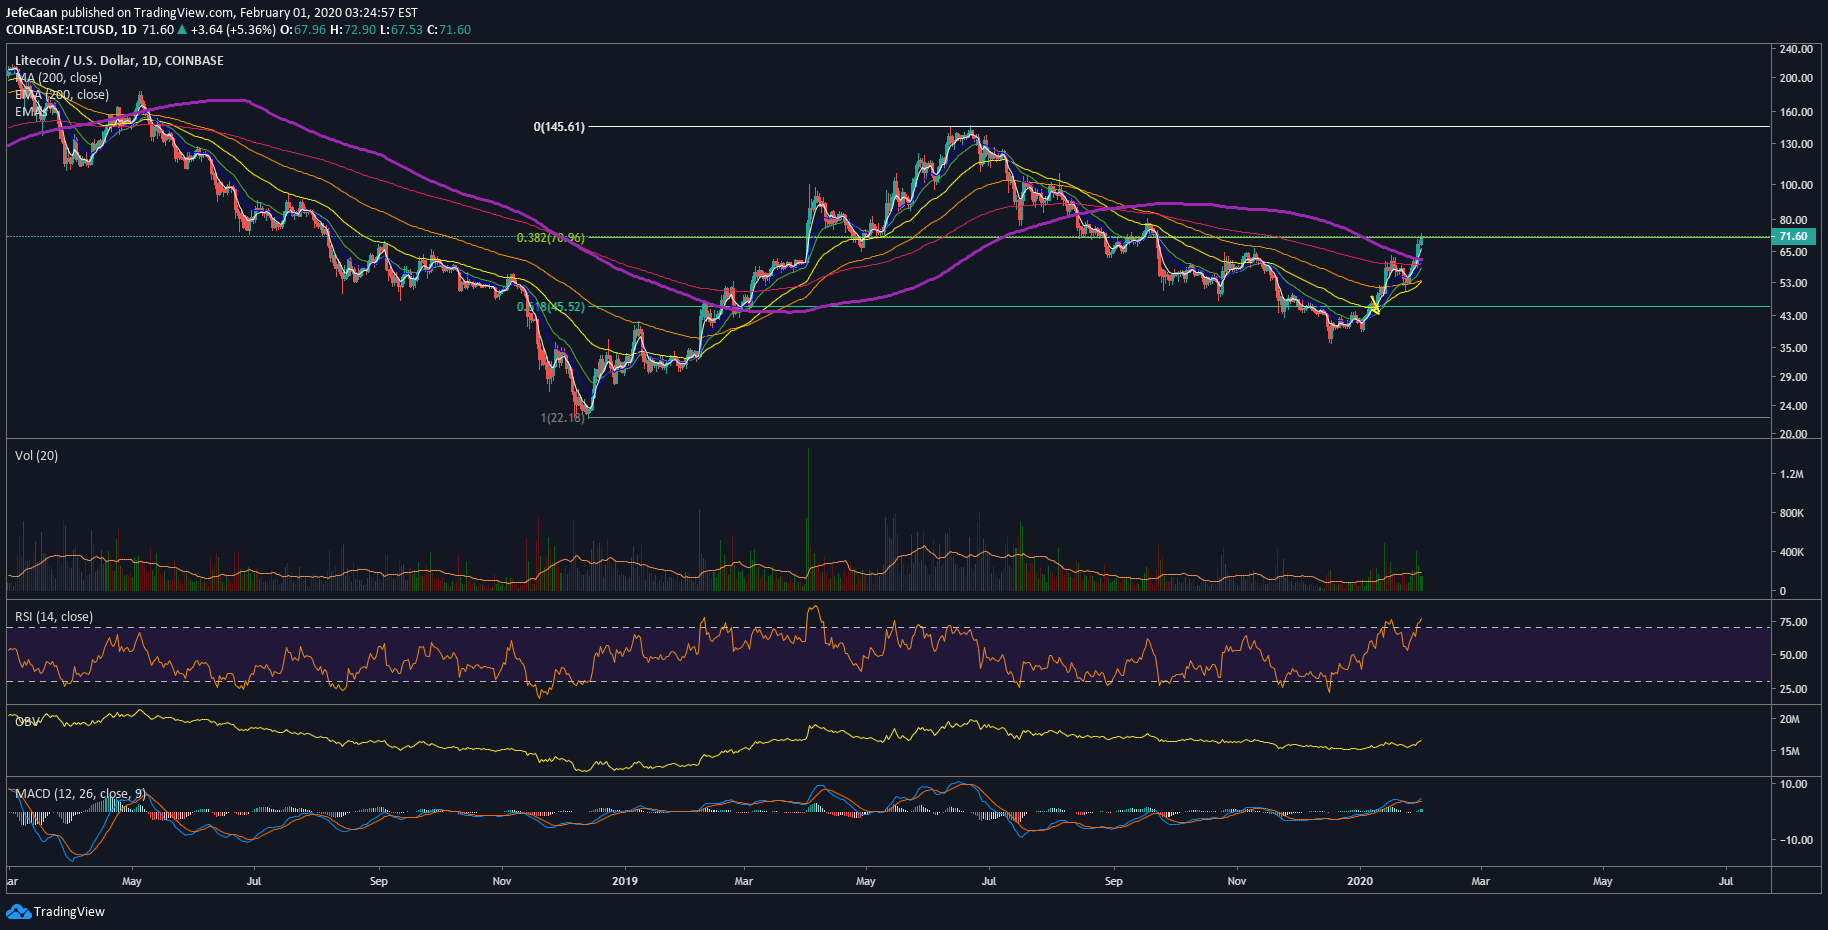
Litecoin (LTC) is now at risk of giving up most of its gains as it has faced a strong rejection at the 38.2% fib retracement level. For most retail bears this is usually an opportunity to go short but most whales and market makers are aware of this which is why caution must be exercised before rushing into a trade just yet. The price still remains above the 200 day-moving average and as long as it remains above that level, it is risky to short sell. That being said, a decline from here could be aggressive as we saw in August of last year. It could also be the beginning of a long bear trend leading to LTC/USD eventually declining below its previous low of December, 2018.
The daily chart for LTC/USD shows us that the trend is still bearish long term. We need to see a series of higher highs and higher lows above the 200-day moving average to have confirmation of a trend reversal. As traders, it should make no difference to us which way the price swings as long as we have confirmation of the trend. Betting on the price having entered a new trend is risky at this point simply because we don’t have confirmation. The reason a lot of traders are still rushing into their long trades and buying is because of the upcoming Bitcoin halving. It is also rumored that Litecoin may soft fork around the same time which has added to the interest in this cryptocurrency. It is important to realize that the market could be misleading short-term and it is not worth the risk to be chasing any bullish moves at this point.
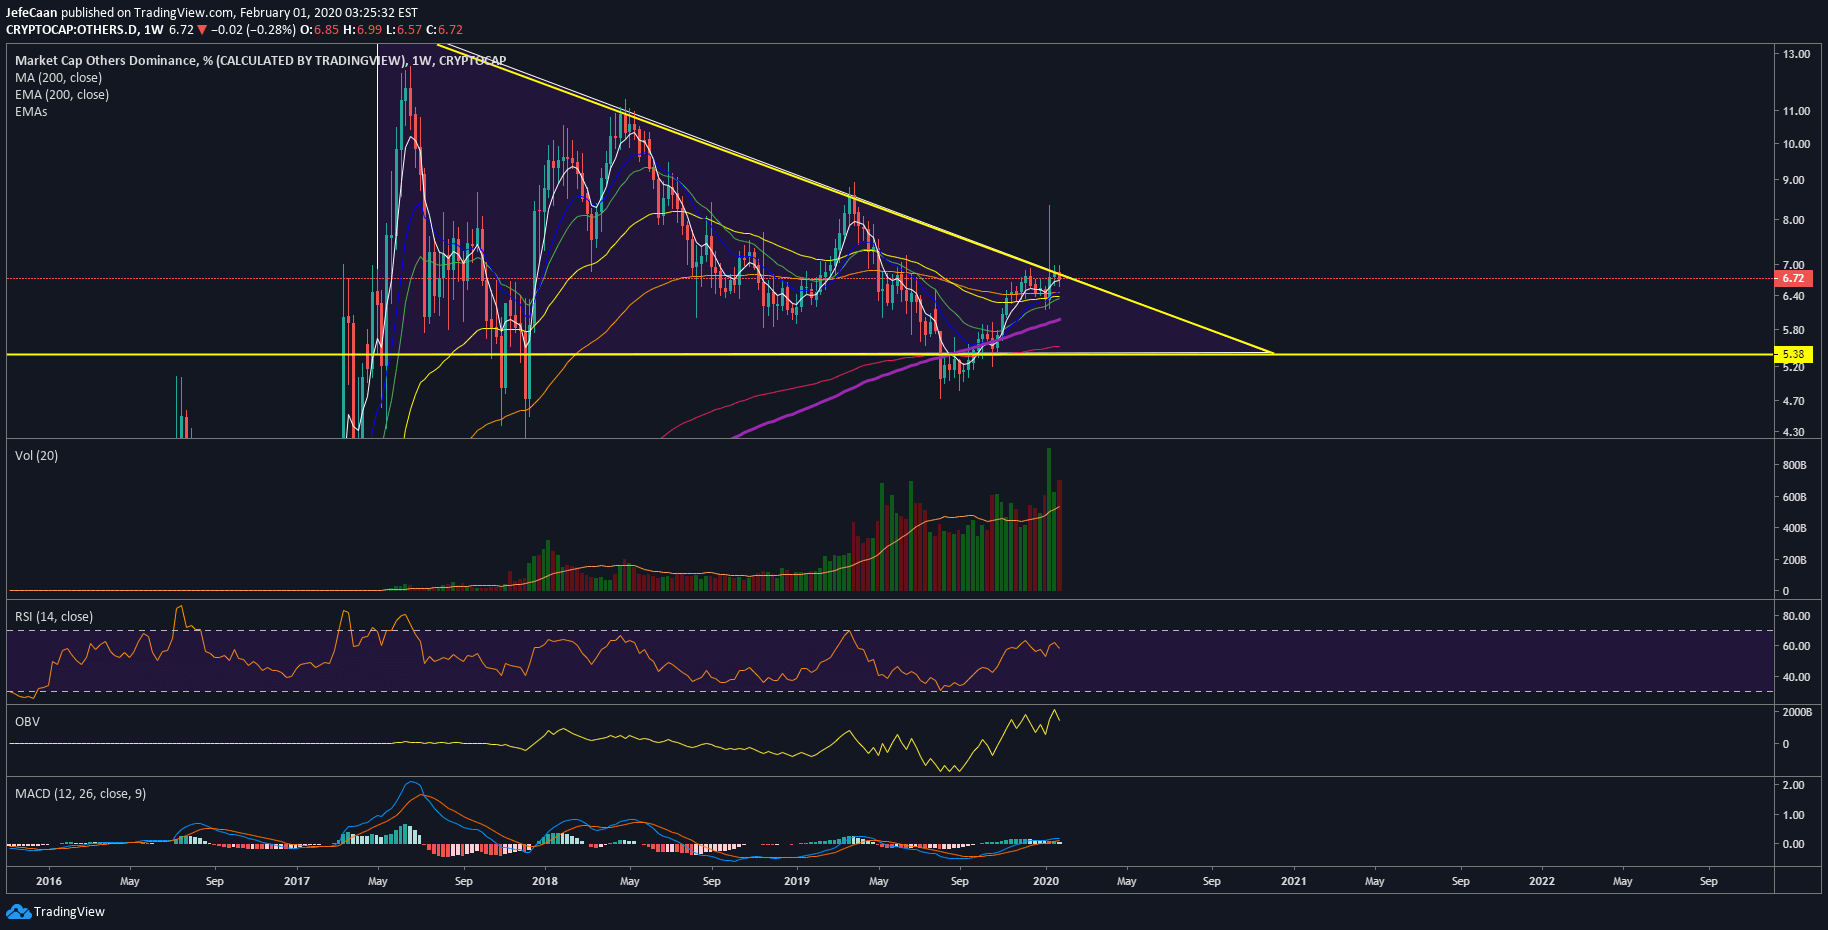
The daily chart for altcoin dominance (Others.D) shows that we are now at a critical juncture in the altcoin market and a decline could be expected any time soon. We would have normally waited to see a false breakout before that downtrend but if we look at this chart, we can see that a false breakout already occurred and the candled ended up closing back inside the descending triangle.
We have seen multiple times in this market that descending triangles lead to a decline. Now, they may not necessarily break to the downside at first but ultimately, they lead to a downside most of the time. So, this is what we are currently looking at in the altcoin market. A declining altcoin dominance is devastating for the market because when it happens on a longer time frame, it indicates that the market is headed into a bear trend as a whole.
The next downtrend in this market has the potential to push Bitcoin (BTC) off its course and well below a key trend line support and potentially below the 200-Week moving average. This would be something unprecedented and extremely bearish for the market. So, while everyone is so sure about the market rallying this year, maybe it is time to step back and look at the big picture, assess risk/reward and wait for confirmation before entering trades.
Investment Disclaimer