Published
4 years ago on
March 26, 2020
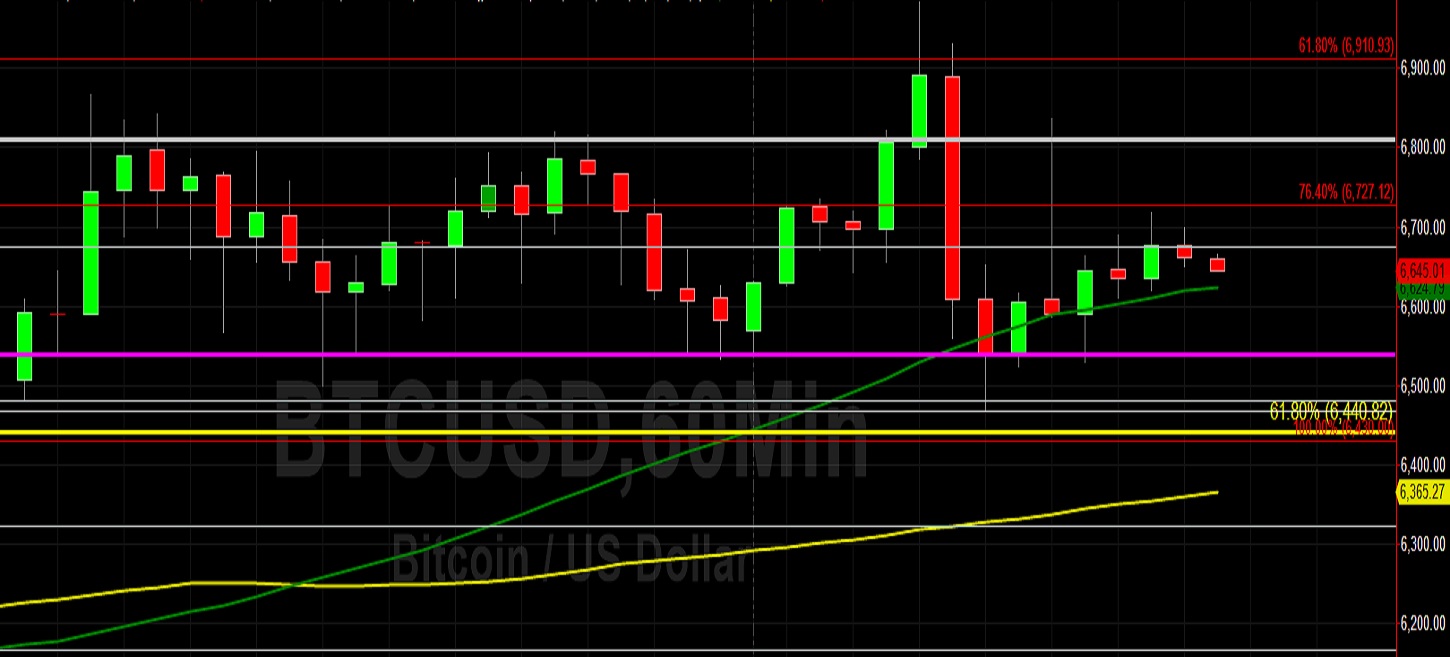
Bitcoin (BTC/USD) extended its recent rangebound trading early in today’s Asian session as the pair continued to orbit the 6700 figure after trading as high as the 6983.31 level during yesterday’s European session before trading as low as the 6470.00 area during yesterday’s European session. Notably, the high during yesterday’s European session was right around the 6979.43 area, an upside price objective related to buying pressure that emerged around the 3858.00 area on 13 March. Some additional Stops have recently been elected above the 6950 area during BTC/USD’s move higher, a downside price objective related to selling pressure that emerged around the 7986 area. Chartists note that the 50-bar MA (hourly) has just crossed above the 100-bar MA (hourly), and that the 50-bar MA (4-hourly) is bullishly converging with the 100-bar MA (4-hourly).
After opening the month around the 8525 area and escalating higher to the 9214 area, BTC/USD quickly depreciated to the 3858 area. The pair then traded sideways before escalating from the 4309 area to the 6990 area and then depreciating sharply to the 5657 area. BTC/USD then escalated to multi-day highs around the 6866 and 6983 areas. Stops were elected below many areas during the rapid decline, and these levels include the 6120, 6059, 6044, 5951, 5941, 5823, and 5799 levels. Above current market levels, traders are observing upside price objectives around the 7101.76, 7234.54, 7414.53, 7558.22, and 7761.66 levels. Below current market activity, traders are closely watching levels including the 4342, 3688, 2882, and 2673 levels. Stops are likely in place below these levels.
Price activity is nearest the 100-bar MA (4-hourly) at 6193.35 and the 50-bar MA (Hourly) at 6620.31.
Technical Support is expected around 4342.13/ 3688.61/ 2882.04 with Stops expected below.
Technical Resistance is expected around 7101.76/ 7234.54/ 7414.53 with Stops expected above.
On 4-Hourly chart, SlowK is Bearishly below SlowD while MACD is Bullishly above MACDAverage.
On 60-minute chart, SlowK is Bullishly above SlowD while MACD is Bearishly below MACDAverage.
Investment Disclaimer