Published
3 years ago on
April 28, 2020
Bitcoin (BTC/USD) continued to drift lower early in today’s Asian session as the pair was unable to sustain a move to the 7810.99 level during yesterday’s Asian session and came off to the 7635.69 level during yesterday’s North American session. Stops were elected below the 7650.17 level during the depreciation in yesterday’s North American session, a level that represents the 38.2% retracement of the appreciation from 7390.00 to 7810.99. Some clues emerged during yesterday’s European and North American sessions regarding the short-term direction of BTC/USD when the pair encountered selling pressure around the 7735.24 level, representing the 23.6% retracement of the appreciation from 7490.00 to 7810.99. During Sunday’s push higher to fresh multi-week highs, Stops were elected above the 7775.00 area, the pair’s previous recent relative high. Above current price activity, upside price objectives include the 8032, 8162, 8258, and 8405 levels, areas related to downside selling pressure that emerged around February and March.
If short-term weakness develops, traders will carefully monitor price behaviour around related areas of potential technical support, including the 7315.29 and 7206.69 levels. Significant Stops were elected above the 7497.49, 7584, and 7661 levels during the move higher last week, and traders will be curious to see how price activity reacts around these areas. Traders are also very interested to see how the market reacts around the 7466 area, a level above which Stops were reached during yesterday’s North American session, and that represented a historical relative high dating to early April. Below current price activity, downside price objectives include the 6959, 6767, 6403, 6383, 6291, and 6122 levels. Chartists are observing that the 50-bar MA (4-hourly) continues to indicate above the 100-bar MA (4-hourly). Also, the 50-bar MA (hourly) has bullishly moved above the 100-bar MA (hourly), and continues to indicate above the 200-bar MA (hourly).
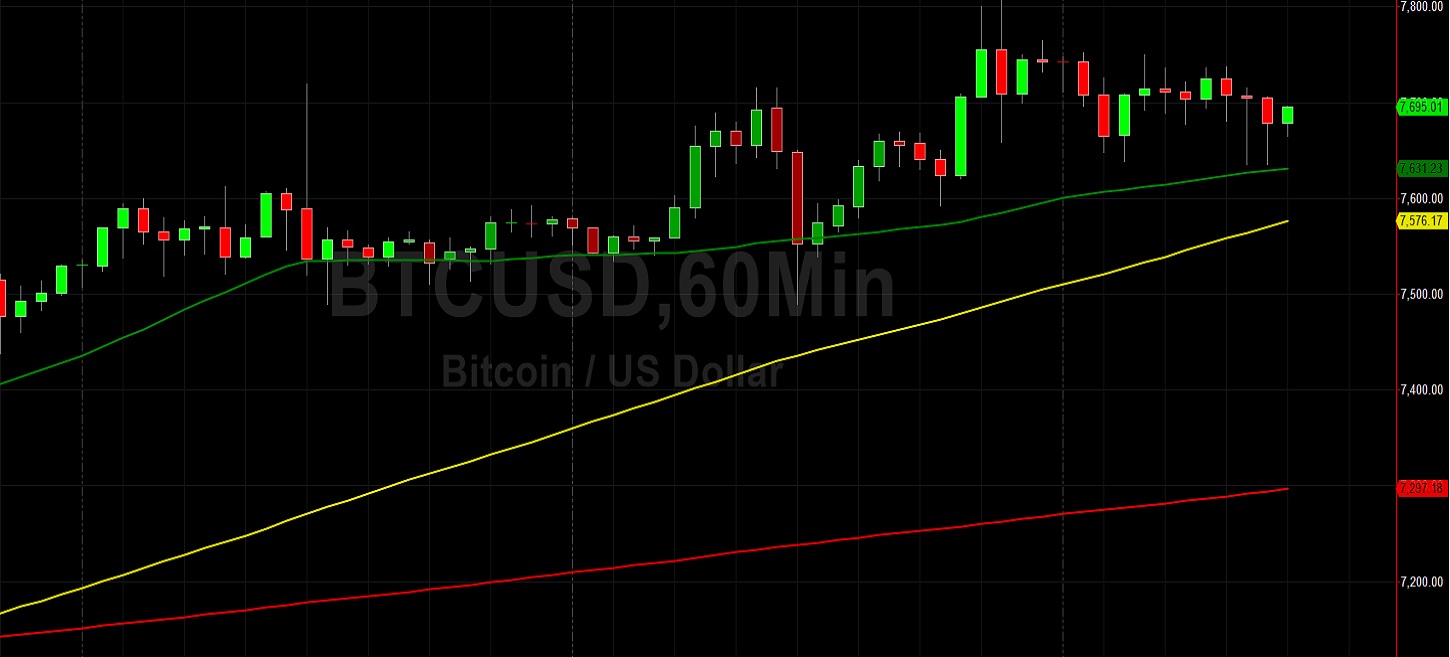
Price activity is nearest the 50-bar MA (4-hourly) at 7295.47 and the 50-bar MA (Hourly) at 7630.83.
Technical Support is expected around 6481.88/ 6383.48/ 6250.85 with Stops expected below.
Technical Resistance is expected around 8258.59/ 8405.58/ 8484.22 with Stops expected above.
On 4-Hourly chart, SlowK is Bearishly below SlowD while MACD is Bearishly below MACDAverage.
On 60-minute chart, SlowK is Bearishly below SlowD while MACD is Bearishly below MACDAverage.
Investment Disclaimer