Published
3 years ago on
August 08, 2020
Ethereum (ETH/USD) gave back some gains in today’s North American session as the pair weakened to the 386.39 area after trading as high as the 393.49 area earlier in the North American session. The pair had traded as low as the 376.18 area during the Asian session and steadily appreciated during the European session, stopping short of testing the psychologically-important 400.00 figure again. Stops were recently triggered below the 380.40 area, representing the 23.6% retracement of the appreciating range from 268.39 to 415.00, and stopped just short of testing the 374.08 and 372.25 levels, key retracement levels related to buying activity that emerged around the 241.62 and 233.85 levels. Following the pair’s recent run-up, important technical levels include the 376.58, 374.08, 372.25, 366.88, 358.99, 348.77, 345.80, 345.16, 341.70, and 328.31 areas. Chartists are awaiting to see if the pair can get back to the 396.69 area, representing the 23.6% retracement of the historical depreciation from 1419.96 to 80.60. Recently, the pair has encountered buying pressure around the 23.6% retracement of the appreciating range from 268.39 to 415.00. Downside retracement levels in this appreciating range include the 373.89, 364.70, 355.50, 344.13, and 342.42 areas. ETH/USD recently spiked to the 415.00 area, a test of the 418.79 level that represents the 61.8% retracement of the historical depreciation from 627.83 to 80.60.
Additional upside price objectives include the 425.31, 437.31, and 454.79 areas. Stops were recently elected above the 336.10, 337.33, 342.29, 350.44, 354.22, 366.48, and 369.26 areas during the move higher. Last week, bids emerged just above the 314.07 area, a level that represents the 50% retracement of the broad historical depreciation from the 547.54 to 80.60. A couple of interesting levels that traders will observe during retracements lower include the 301.20 and 301.40 areas, and they are related to buying pressure that emerged around the 241.62 and 319.86 areas. Likewise, the 312.82, 316.32, and 322.16 levels are areas with important technical significance. Chartists are observing that the 50-bar MA (4-hourly) is bullishly indicating above the 100-bar MA (4-hourly) and above the 200-bar MA (4-hourly). Also, the 50-bar MA (hourly) is bearishly indicating below the 100-bar MA (hourly) and above the 200-bar MA (hourly).
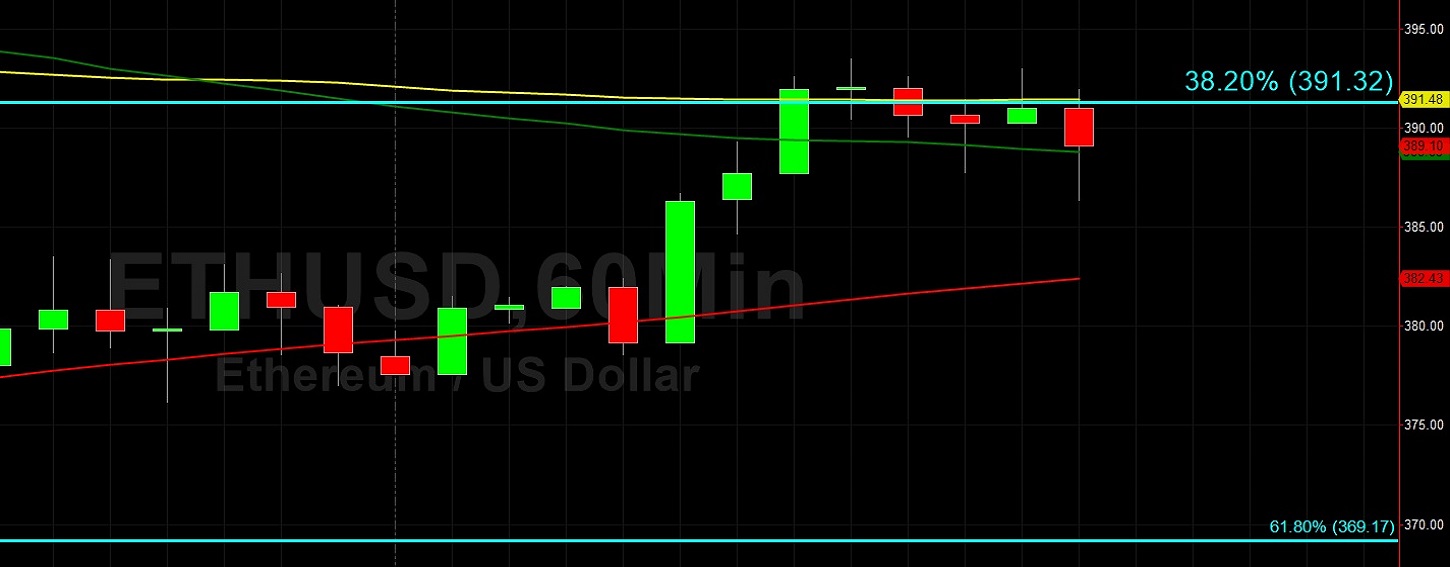
Price activity is nearest the 50-bar MA (4-hourly) at 393.57 and the 50-bar MA (Hourly) at 388.82.
Technical Support is expected around 349.75/ 331.95/ 315.08 with Stops expected below.
Technical Resistance is expected around 425.31/ 437.31/ 454.79 with Stops expected above.
On 4-Hourly chart, SlowK is Bullishly above SlowD while MACD is Bearishly below MACDAverage.
On 60-minute chart, SlowK is Bearishly below SlowD while MACD is Bullishly above MACDAverage.
Investment Disclaimer