Published
3 years ago on
September 22, 2020
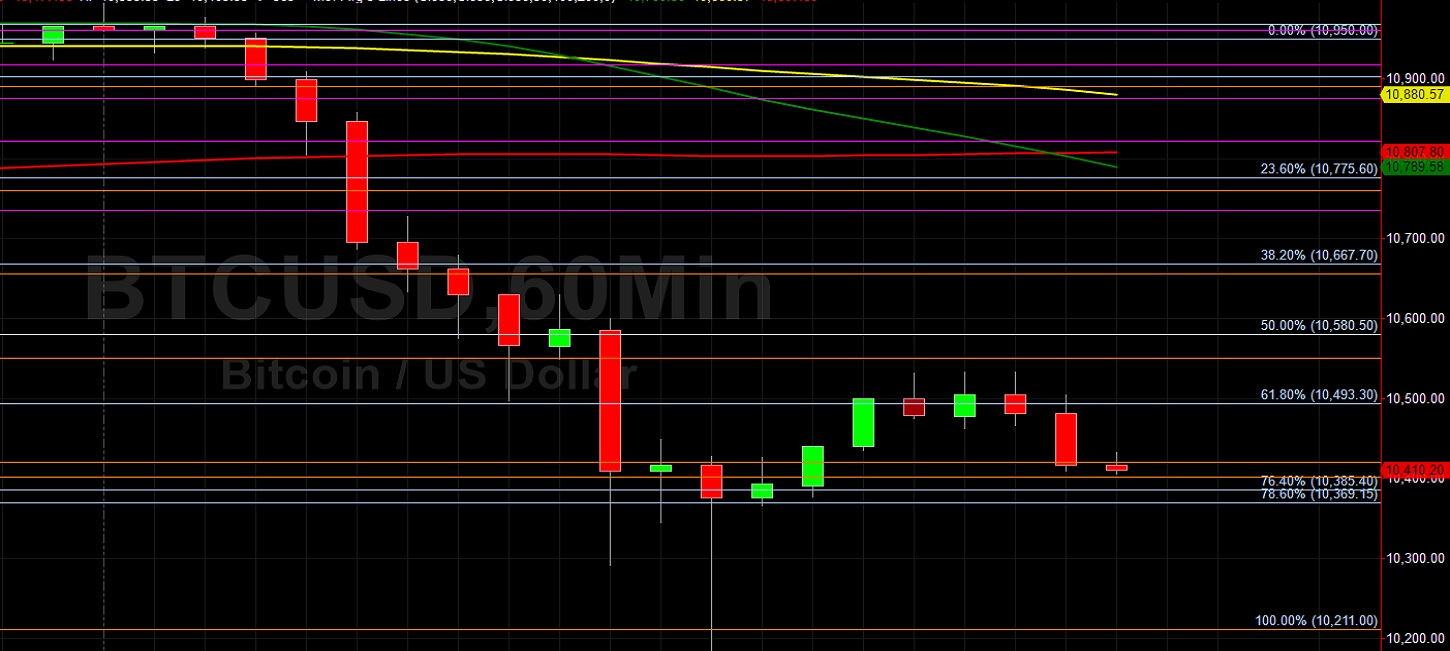
Bitcoin (BTC/USD) backed away from the 11000 figure early in today’s Asian session as the pair weakened after encountering selling pressure around the 10994.00 area during yesterday’s Asian session, trading as low as the 10180.00 area. Stops were elected below the 10802.42 area during the sharp pullback, right around the 200-hour simple moving average. Some buying pressure finally emerged around the 10562.09 area after Stops were elected below the 10580.50 area, a level that represents the 50% retracement of the recent appreciating range from 10211.00 to 10950.00. Also, this area was just above the 10550.58 area that represents the 61.8% retracement of the recent appreciating range from 10211.00 to 11099.95. Stops were also triggered below the 100-bar 4-hourly simple moving average during yesterday’s North American session. Traders also observed an acceleration of selling pressure below additional retracement levels including the 10685.51 and 10449.19 areas, with the latter being the 23.6% retracement of the depreciating range from 12486.61 to 9819.83. Stops were also reached below the 10211.00 area.
Stops were recently elected below the 11120, 11004.10, 10961.41, 10647.72, 10546.15, and 10450.26 areas during the depreciation from recent multi-week highs. Traders note that the recent high of 12486.61 represented a test of the 12496.68 area, an upside price objective related to buying pressure that emerged around the 8055.91 area earlier this year. Traders also remain focused on the 12023.45, 11964.56, 11880.38, 11803.31, 11737.30, 11642.95, 11560.28, and 11533.51 areas during pullbacks higher, representing the retracements of the recent appreciating ranges that commenced around the 9005.00, 8905.84, 8815.01, and 8632.93 areas. Other important technical levels include the 11510.44 area, representing the 50% retracement of a historical depreciation from 19891.99 to 3128.89, as well as the 10200.39, 10139.11, and 10082.97 areas. Chartists are observing that the 50-bar MA (4-hourly) is bullishly indicating above the 200-bar MA (4-hourly) and above the 100-bar MA (4-hourly). Also, the 50-bar MA (hourly) is bullishly indicating above the 100-bar MA (hourly) and above the 200-bar MA (hourly).
Price activity is nearest the 100-bar MA (4-hourly) at 10535.32 and the 200-bar MA (Hourly) at 10805.28.
Technical Support is expected around 10211.00/ 9816.32/ 9861.42 with Stops expected below.
Technical Resistance is expected around 11496.70/ 11601.04/ 12086.00 with Stops expected above.
On 4-Hourly chart, SlowK is Bearishly below SlowD while MACD is Bearishly below MACDAverage.
On 60-minute chart, SlowK is Bullishly above SlowD while MACD is Bearishly below MACDAverage.
Investment Disclaimer