
Published
3 years ago on
September 20, 2020
Bitcoin (BTC/USD) saw some improved sentiment early in today’s Asian session as the pair continued to try to add to recent upside gains around the 11000 figure. Stops were elected above the 11153.22 area during yesterday’s European session, representing the 50% retracement of the recent depreciating range from 12486.61 to 9819.83. The next upside levels in this range include the 11467.90 and 11857.25 areas. Traders pushed the pair higher to the 11179.90 area during yesterday’s North American session before some selling pressure emerged. Additional upside levels that are being closely watched include the 11220.32 and 11551.18 areas, and Stops are likely in place above these areas. Chartists are observing that the 50-bar 4-hourly simple moving average has bullishly crossed above the 100-bar 4-hourly simple moving average. When price activity pulls back, traders will observe how price activity reacts around the 10685.51 and 10952.92 areas, representing the 38.2% and 50% retracements of the recent depreciation from 12086 to 9819.83. Also, the 10449.19 area represents the 23.6% retracement of the depreciating range from 12486.61 to 9819.83. Some Stops were also recently elected above the 10826.66 area in the recent move higher, a level that represents the 61.8% retracement of the recent appreciation from 8940.14 to 13878.67.
Stops were recently elected below the 11120, 11004.10, 10961.41, 10647.72, 10546.15, and 10450.26 areas during the depreciation from recent multi-week highs. Traders note that the recent high of 12486.61 represented a test of the 12496.68 area, an upside price objective related to buying pressure that emerged around the 8055.91 area earlier this year. Traders also remain focused on the 12023.45, 11964.56, 11880.38, 11803.31, 11737.30, 11642.95, 11560.28, and 11533.51 areas during pullbacks higher, representing the retracements of the recent appreciating ranges that commenced around the 9005.00, 8905.84, 8815.01, and 8632.93 areas. Other important technical levels include the 11510.44 area, representing the 50% retracement of a historical depreciation from 19891.99 to 3128.89, as well as the 10200.39, 10139.11, and 10082.97 areas. Chartists are observing that the 50-bar MA (4-hourly) is bearishly indicating below the 200-bar MA (4-hourly) and above the 100-bar MA (4-hourly). Also, the 50-bar MA (hourly) is bullishly indicating above the 100-bar MA (hourly) and above the 200-bar MA (hourly).
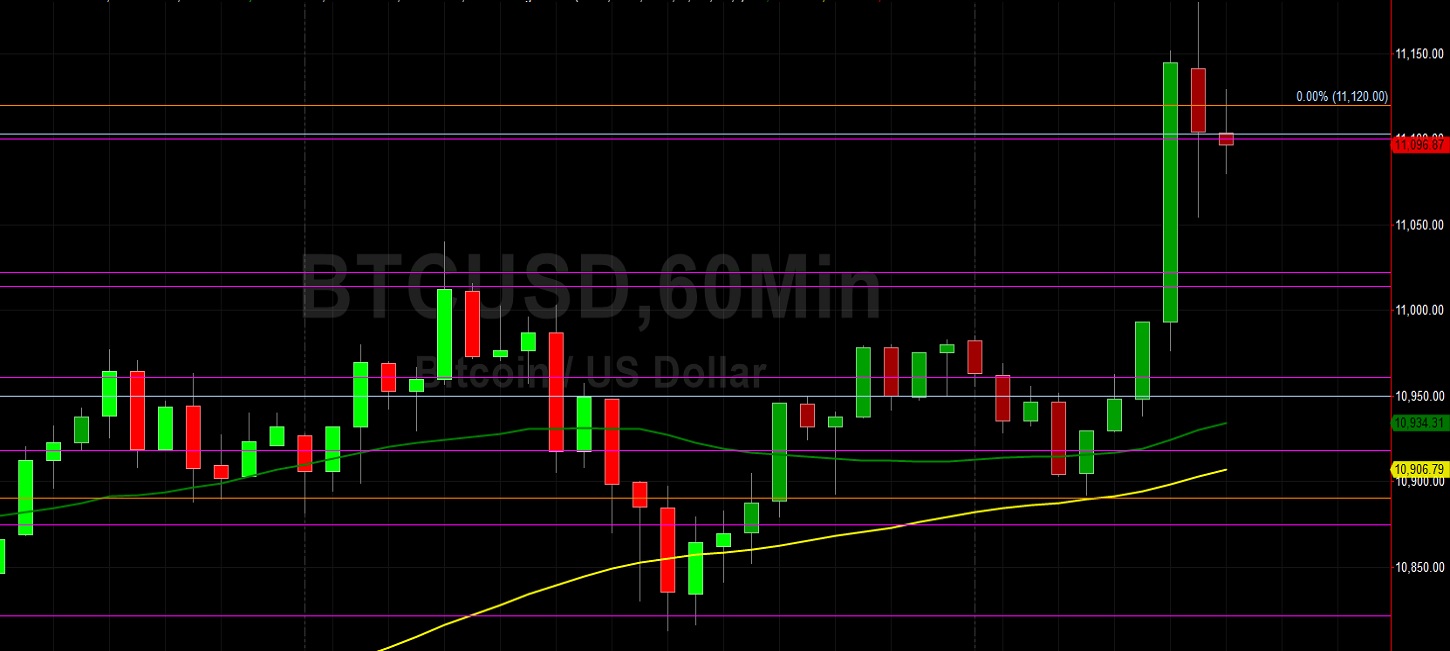
Price activity is nearest the 200-bar MA (4-hourly) at 11089.74 and the 50-bar MA (Hourly) at 10934.58.
Technical Support is expected around 10667.70/ 9816.32/ 9861.42 with Stops expected below.
Technical Resistance is expected around 11496.70/ 11601.04/ 12086.00 with Stops expected above.
On 4-Hourly chart, SlowK is Bullishly above SlowD while MACD is Bullishly above MACDAverage.
On 60-minute chart, SlowK is Bearishly below SlowD while MACD is Bullishly above MACDAverage.
Investment Disclaimer


