Published
3 years ago on
September 24, 2020
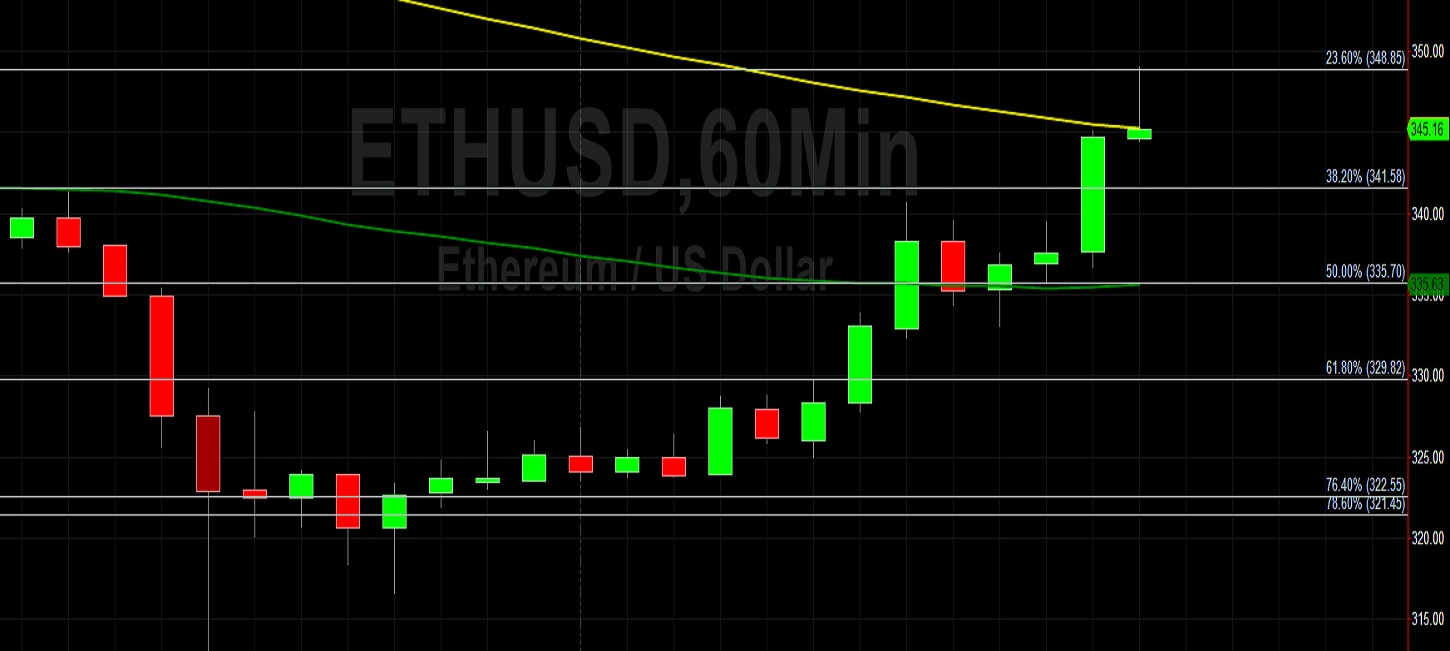
Ethereum (ETH/USD) moved higher early in today’s North American session as the pair appreciated to the 343.21 area after trading as low as the 313.00 area during the Asian session, representing a test of the 314.17 area that represents the 50% retracement of the historical depreciation from 547.57 to 80.77. Technical resistance emerged right around the 100-hour simple moving average during the North American session, and this area was also around a retracement level related to the recent depreciating range from 346.84 to 332.77. Chartists are observing that the 200-bar 4-hourly simple moving average has recently bearishly crossed above the 100-bar 4-hourly simple moving average and 50-bar 4-hourly simple moving average, and that the 50-hour simple moving average remains bearishly below the 200-hour simple moving average and 100-hour simple moving average. Stops were recently elected above the 387.15 area during the move higher, representing the 61.8% retracement of the recent depreciating range from 394.55 to 375.19, and the next upside retracement level in this range is the 389.98 area. Traders recently took the pair as high as the 394.55 area, and selling pressure prevented a test of the 399.87 area, representing the 50% retracement of the recent depreciating range from 488.95 to 310.79. The next upside retracement levels in this range include the 420.89 and 446.90 areas. The 328.78, 319.75, and 311.90 areas are important technical areas that traders are monitoring, as are the 302.20, 293.56, 289.64, 285.23, and 279.77 levels.
Traders recently drove the pair as high as the 488.95 area after some Stops were elected above the 487.55 area, its first test of the psychologically-important 500.00 figure since July 2018. Stops have recently been elected below the 394.80, 389.94, 384.36, 376.07, 369.57, 359.36, and 345.38 areas during the pair’s recent depreciation from the 488.95 area, and traders are curious to see how price activity reacts around these levels. The 396.69 area remains an important technical level, representing the 23.6% retracement of the historical depreciation from 1419.96 to 80.60, and trader are curious to see if ETH/USD can reclaim this level. Following the pair’s recent appreciation, some additional important technical levels include the 416.00, 409.64, 389.91, 383.02, 374.83, and 359.36 areas. Traders are observing that the 50-bar MA (4-hourly) is bearishly indicating below the 200-bar MA (4-hourly) and below the 100-bar MA (4-hourly). Also, the 50-bar MA (hourly) is bearishly indicating below the 100-bar MA (hourly) and below the 200-bar MA (hourly).
Price activity is nearest the 50-bar MA (4-hourly) at 362.37 and the 100-bar MA (Hourly) at 345.29.
Technical Support is expected around 315.08/ 302.20/ 279.77 with Stops expected below.
Technical Resistance is expected around 399.87/ 411.48/ 420.89 with Stops expected above.
On 4-Hourly chart, SlowK is Bullishly above SlowD while MACD is Bullishly above MACDAverage.
On 60-minute chart, SlowK is Bullishly above SlowD while MACD is Bullishly above MACDAverage.
Investment Disclaimer