
Published
3 years ago on
September 15, 2020
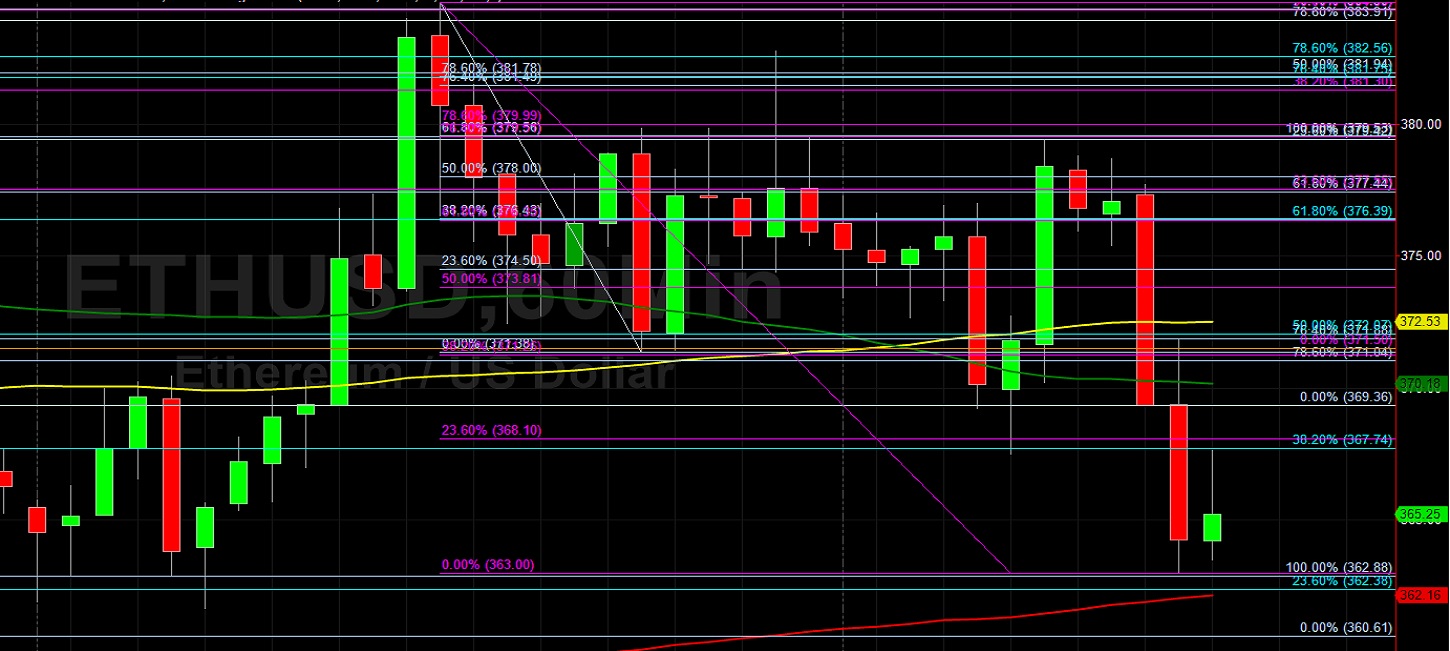
Ethereum (ETH/USD) came off early in today’s North American session as the pair depreciated to the 363.00 area after trading as high as the 382.76 area during the Asian session, just above the 382.56 area that represents the 78.6% retracement of the recent depreciation from 390.41 to 353.72. During a drive higher from the 367.50 area during the European session, ETH/USD topped out around the 379.36 area, right around the 23.6% retracement of the recent depreciating range from 411.97 to 369.36. Bids emerged around the 363.00 area during the North American session, just above previous technical support around the 362.88 level. This area is also right around the 50-bar, 4-hourly simple moving average. The 328.78, 319.75, and 311.90 areas are important technical areas that traders are monitoring, as are the 302.20, 293.56, 289.64, 285.23, and 279.77 levels. Technical trading was recently evident when the pair failed to sustain a break of the 444.08 area, representing the 23.6% retracement of the recent appreciation from 371.50 to 488.95. Stops were then elected below the 430.23 and 416.37 areas during the downturn, representing the 50% and 61.8% retracements of the appreciating range. Traders recently drove the pair as high as the 488.95 area after some Stops were elected above the 487.55 area, its first test of the psychologically-important 500.00 figure since July 2018.
Stops have recently been elected below the 394.80, 389.94, 384.36, 376.07, 369.57, 359.36, and 345.38 areas during the pair’s recent depreciation from the 488.95 area, and traders are curious to see if these levels provide any technical resistance during retracements higher. The 396.69 area remains an important technical level, representing the 23.6% retracement of the historical depreciation from 1419.96 to 80.60, and trader are curious to see if ETH/USD can reclaim this level. Following the pair’s recent appreciation, some additional important technical levels include the 416.00, 409.64, 389.91, 383.02, 374.83, and 359.36 areas. Traders are observing that the 50-bar MA (4-hourly) is bearishly indicating below the 100-bar MA (4-hourly) and below the 200-bar MA (4-hourly). Also, the 50-bar MA (hourly) is bearishly indicating below the 100-bar MA (hourly) and above the 200-bar MA (hourly).
Price activity is nearest the 50-bar MA (4-hourly) at 362.69 and the 200-bar MA (Hourly) at 362.16.
Technical Support is expected around 315.08/ 302.20/ 279.77 with Stops expected below.
Technical Resistance is expected around 393.20/ 411.48/ 420.89 with Stops expected above.
On 4-Hourly chart, SlowK is Bearishly below SlowD while MACD is Bearishly below MACDAverage.
On 60-minute chart, SlowK is Bearishly below SlowD while MACD is Bearishly below MACDAverage.
Investment Disclaimer


