Published
3 years ago on
October 16, 2020
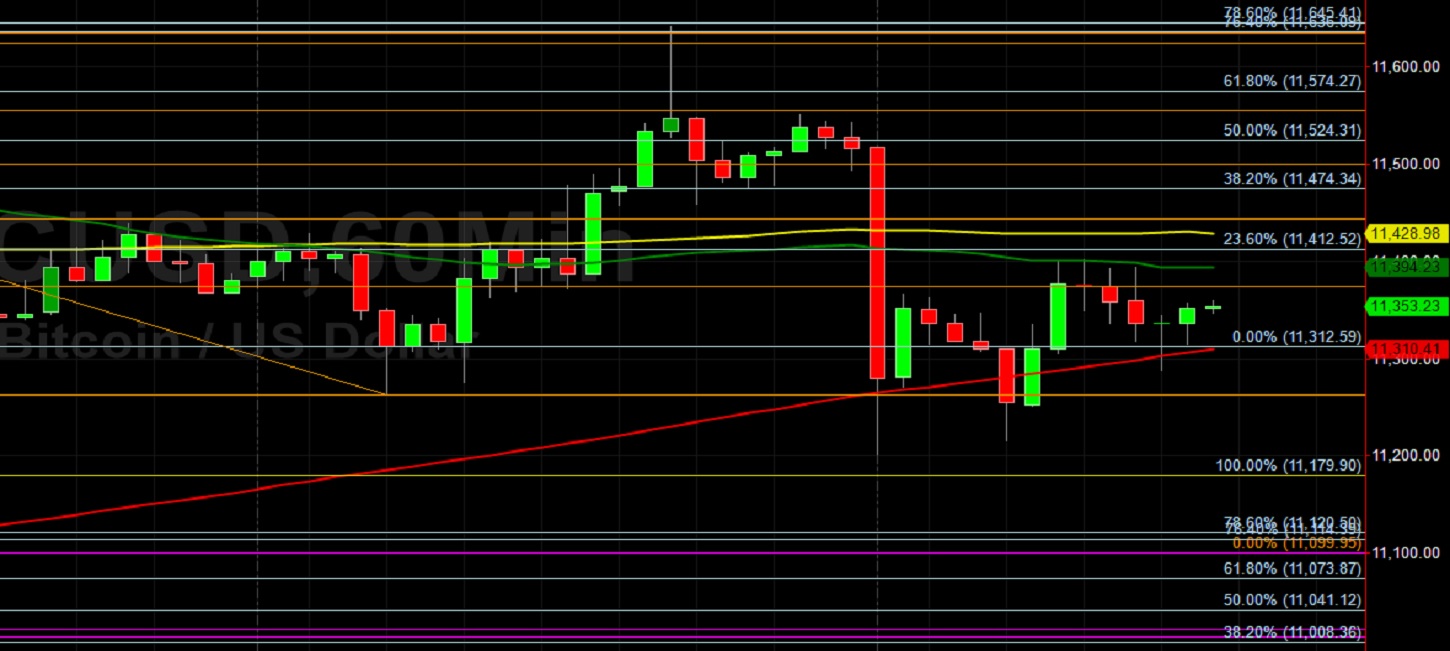
Bitcoin (BTC/USD) reclaimed some lost ground early in today’s North American session as the pair traded as high as the 11402.15 level after trading as low as the 11201.00 area during the Asian session. Traders took BTC/USD as high as the 11641.38 area during the Asian session, right around the 76.4% retracement of the recent depreciating range from 11736.02 to 11312.59. During the pullback lower, BTC/USD remained above the 11179.00 area, a technically significant level. Traders are carefully monitoring the 11857.25 area, representing the 76.4% retracement of the depreciating range from 12086.22 to 11120.00. Stops were recently elected above many additional upside price objectives including the 11120, 11179.90, 11272.86, 11378.11, 11409.40, and 11489.10 levels en route to multi-week highs. Additional upside price objectives include the 11804.29, 11879.45, 11992.15, and 12112.97 areas. Chartists are observing that the 50-hour simple moving average has recently bearishly moved below the 100-hour simple moving average.
Traders note that the recent high of 12486.61 represented a test of the 12496.68 area, an upside price objective related to buying pressure that emerged around the 8055.91 area earlier this year. Traders also remain focused on the 12023.45, 11964.56, 11880.38, 11803.31, 11737.30, 11642.95, 11560.28, and 11533.51 areas during pullbacks higher, representing the retracements of the recent appreciating ranges that commenced around the 9005.00, 8905.84, 8815.01, and 8632.93 areas. Other important technical levels include the 11510.44 area, representing the 50% retracement of a historical depreciation from 19891.99 to 3128.89, as well as the 10200.39, 10139.11, and 10082.97 areas. Chartists are observing that the 50-bar MA (4-hourly) is bullishly indicating above the 100-bar MA (4-hourly) and above the 200-bar MA (4-hourly). Also, the 50-bar MA (hourly) is bearishly indicating below the 100-bar MA (hourly) and above the 200-bar MA (hourly).
Price activity is nearest the 50-bar MA (4-hourly) at 11321.73 and the 200-bar MA (Hourly) at 11310.39.
Technical Support is expected around 10610.94/ 10459.89/ 10135.22 with Stops expected below.
Technical Resistance is expected around 11992.15/ 12086.00/ 12486.61 with Stops expected above.
On 4-Hourly chart, SlowK is Bearishly below SlowD while MACD is Bearishly below MACDAverage.
On 60-minute chart, SlowK is Bullishly above SlowD while MACD is Bearishly below MACDAverage.
Investment Disclaimer