Published
3 years ago on
October 29, 2020
Bitcoin (BTC/USD) moved higher early in today’s North American session as the pair appreciated to the 13255.10 level after trading as low as the 12976.29 area earlier in the North American session, below the 13039.61 area that represents the 76.4% retracement of the appreciating range from 12785.00 to 13863.87. Traders lifted BTC/USD to test the 50-hour simple moving average during the North American session, and then tested the 61.8% retracement of the recent depreciating range from 13863.87 to 12891.57. Notably, BTC/USD recently tested the 13868.44 area, a previous relative high from June 2019. As expected, the pair also recently encountered technical resistance ahead of some upside price objectives between 13875.45 and 13884.29, levels related to buying pressure that emerged much lower around the 3135.90 and 6636.46 areas. Stops were elected below the 13609.26, 13451.74, 13224.44, and 13197.13 levels during the recent pullback, levels related to the recent appreciating range from 12785.00 to 13863.87. Buying pressure recently emerged around the 12865 area, just below the 12872.93 area that represents the 61.8% retracement of the recent appreciating range from 12670.67 to 13200. Another appreciating range that traders are monitoring is the ascent from 12698.02 to 13200.00. A couple of additional appreciating ranges that chartists are watching include the climb from 11201 to 13250.04, and the run-up from 11416.04 to 13250.04.
The 12766.47 and 12817.22 areas are significant potential areas of short-term technical support related to those appreciating ranges. Following the pair’s recent ascent, traders are paying close attention to potential areas of technical support during pullbacks and these include the 12925.89, 12817.22, 12766.47, 12611.92, 12549.45, 12514.94, 12438.90, 12060.18, 11937.09, 11692.63, and 11531.52 areas. Stops were recently elected above many additional upside price objectives including the 11120, 11179.90, 11272.86, 11378.11, 11409.40, 11489.10, 11857.25, 11915.92, and 12023.45 levels. Another important technical level includes the 11510.44 area, representing the 50% retracement of a historical depreciation from 19891.99 to 3128.89, as well as the 10200.39, 10139.11, and 10082.97 areas. Chartists are observing that the 50-bar MA (4-hourly) is bullishly indicating above the 100-bar MA (4-hourly) and above the 200-bar MA (4-hourly). Also, the 50-bar MA (hourly) is bullishly indicating above the 100-bar MA (hourly) and above the 200-bar MA (hourly).
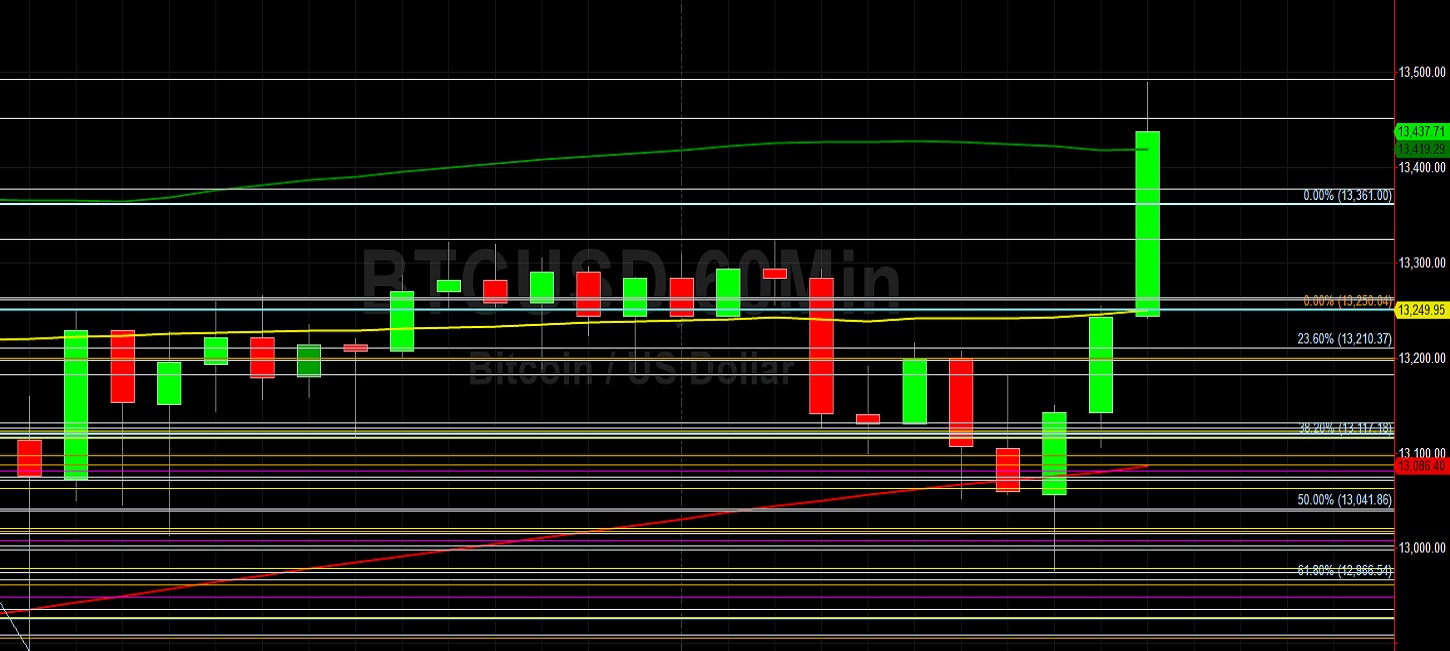
Price activity is nearest the 50-bar MA (4-hourly) at 13101.21 and the 40-bar MA (Hourly) at 13419.68.
Technical Support is expected around 12976.29/ 12772.83/ 12563.28 with Stops expected below.
Technical Resistance is expected around 13863.87/ 14000.81/ 14052.39 with Stops expected above.
On 4-Hourly chart, SlowK is Bullishly above SlowD while MACD is Bearishly below MACDAverage.
On 60-minute chart, SlowK is Bullishly above SlowD while MACD is Bullishly above MACDAverage.
Investment Disclaimer