By Dmitriy Gurkovskiy, Chief Analyst at RoboForex
Cryptocurrencies are correcting again and many assets are forming Triangle patterns, which indicate some uncertainty in further movements. To start growing, each asset must break the pattern’s upside border. However, if the bearish pressure is way too strong and the pattern is broken to the downside, the cryptocurrencies may continue their respective descending corrections. BTC/USD may fall towards $8,000 and complete a bullish pattern, which may be followed by further growth to reach new highs.
Bitcoin
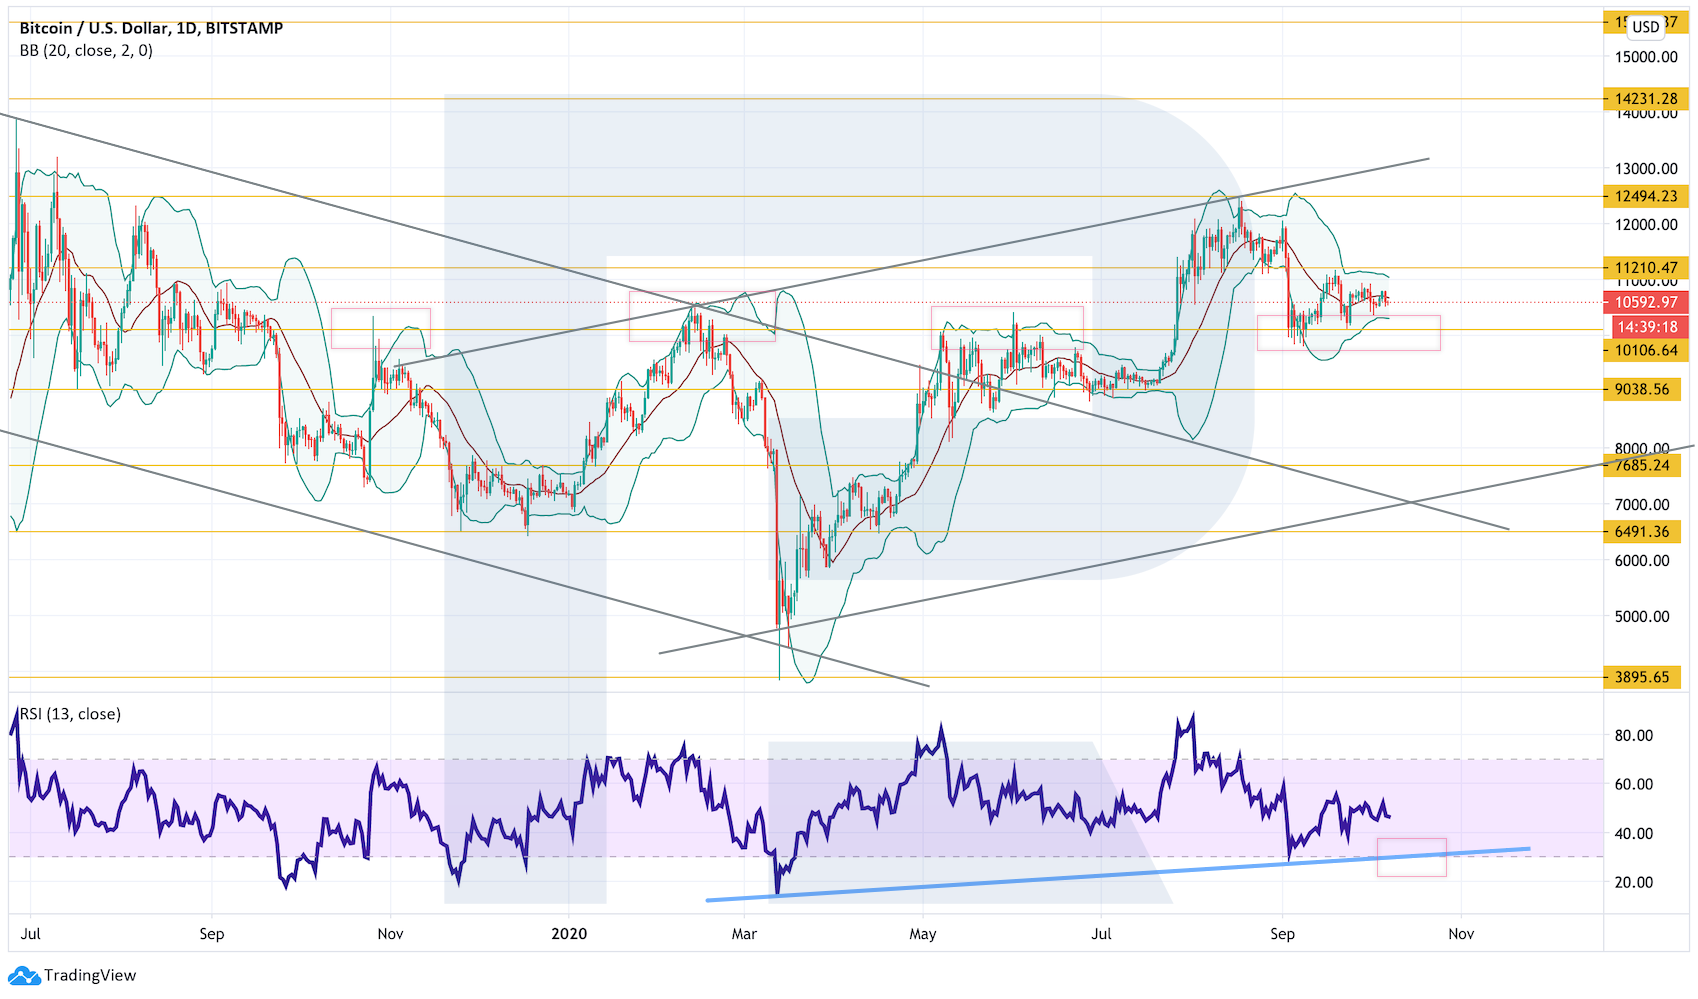
In the daily chart, Bitcoin continues the correction between $11,200 and $10,00. In general, bulls manage to protect an important support area and one shouldn’t expect further decline as long as the price hasn’t broken $10,000. On the other hand, it’s very important for bulls to break $11,200 because in this case the asset may break the upper band of the Bollinger Bands and start a new bullish impulse. If it happens, the cryptocurrency may continue $12,495, a breakout of which may lead to a further uptrend with the target at $14,230. However, if bulls can’t protect $10,000 and bears break it, the instrument will continue falling towards $7,865 where it may complete a bullish “5-0” pattern.
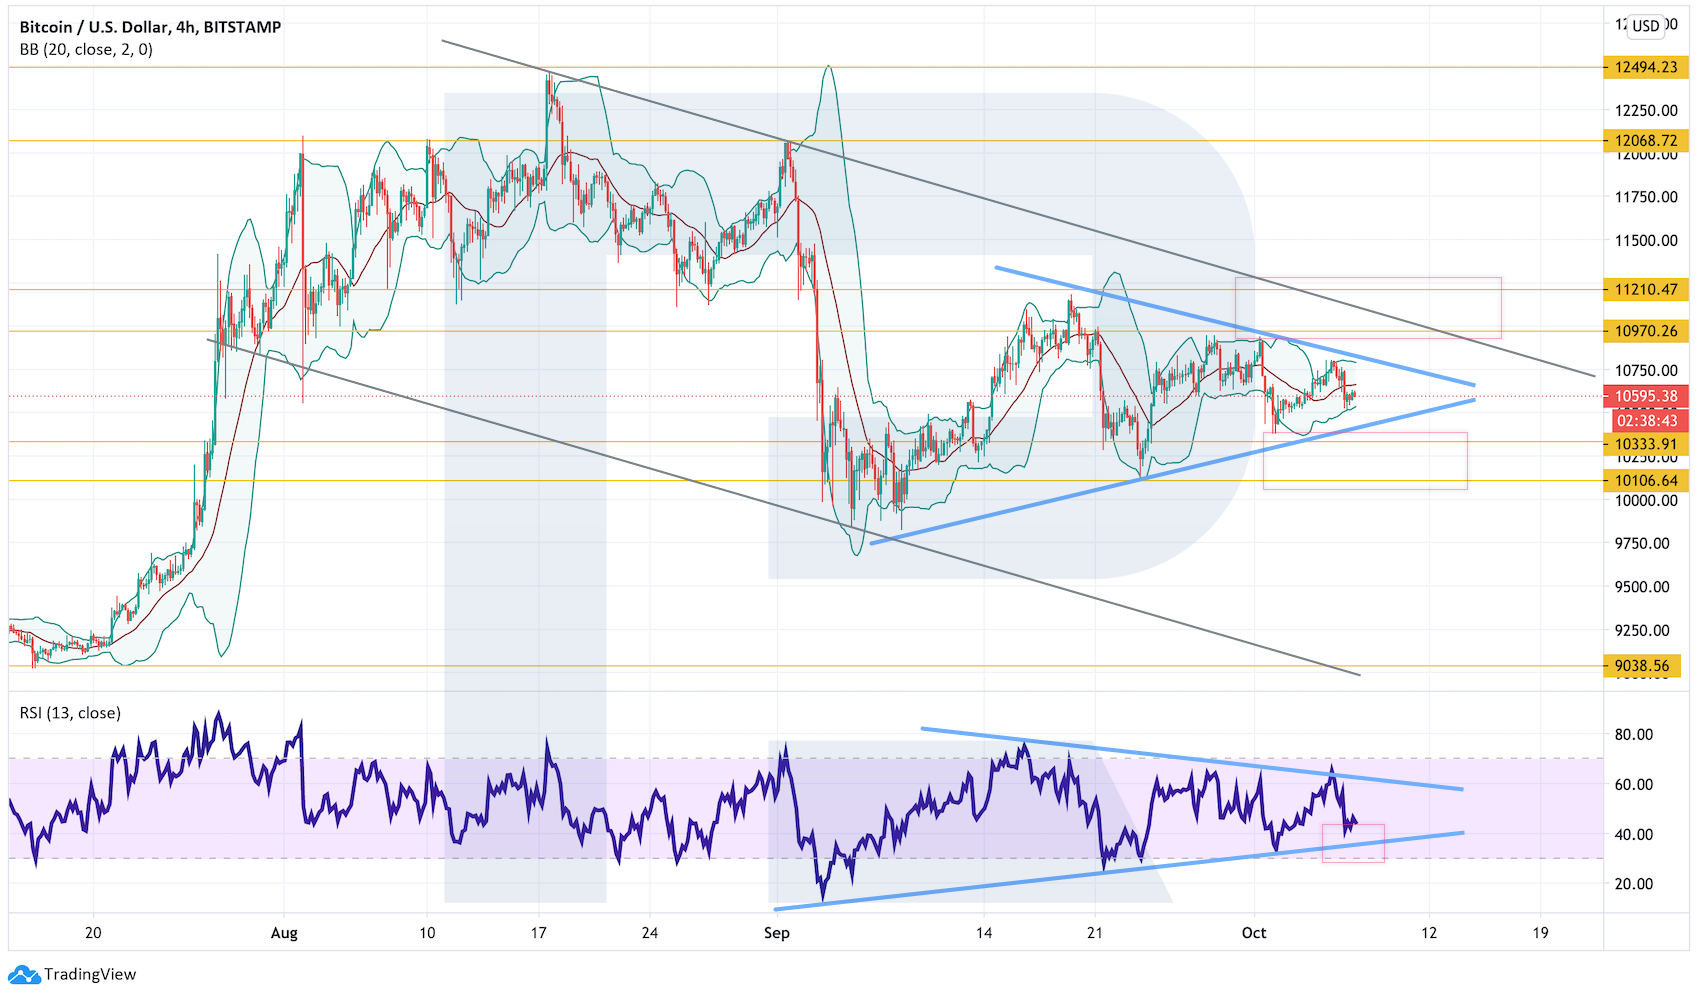
As we can see in the H4 chart, BTC/USD is stuck within a Triangle pattern, which indicates that the uncertainty continues. In the nearest future, one can expect an increase in volatility and a breakout of the pattern. After breaking the pattern to the upside and fixing above $10,970, the cryptocurrency may stop falling and start new growth within the frameworks of the Triangle pattern materialization. In this case, the upside target may be at $12,070. Another signal in favor of this idea will be a rebound from the support line at the RSI. However, this scenario may be canceled if the asset breaks the pattern’s downside border and fixes below $10,100. After that, the instrument may continue falling to reach $9,040 within the frameworks of the pattern materialization.
Ethereum
As we can see in the daily chart, ETH/USD is still rebounding from the middle band of the Bollinger Bands indicator, which means that the bearish pressure continues. That’s why, one shouldn’t exclude one more attempt of another decline towards $306, which may be followed by a rebound and further growth with the potential target at $490. An additional signal in favor of this idea will be a rebound from the support line at the RSI – one can see that the previous test resulted in a rebound to the upside. However, this scenario may no longer be valid if the instrument breaks the rising channel’s downside border and fixes below $300. In this case, a bullish “5-0” pattern will be canceled and the market may continue falling with the target at $208.
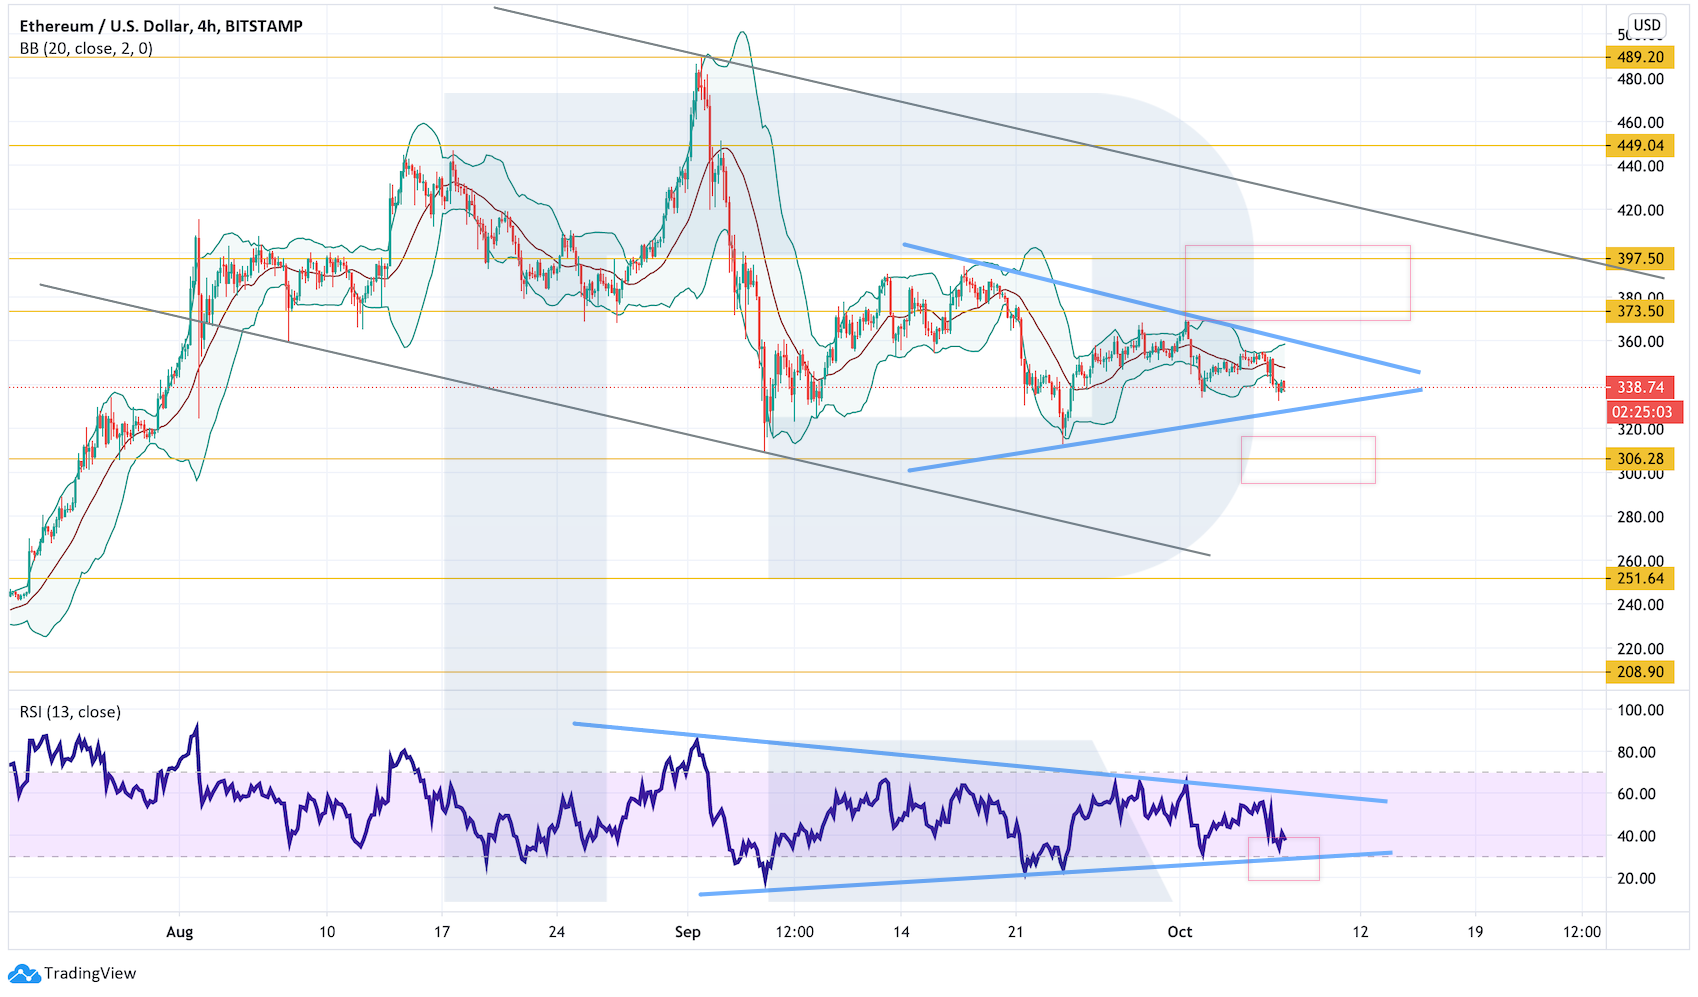
On shorter timeframes, bulls weren’t to force the Double Bottom reversal pattern materialization. Right now, the cryptocurrency is moving within a Triangle pattern. There has been a rebound from the support line at the RSI, that’s why one shouldn’t exclude an attempt to grow and break the latter pattern’s upside border. As soon as bulls are able to break $397, the asset may continue trading upwards to reach $490 within the frameworks of the Triangle pattern materialization. However, this scenario may be canceled if the instrument breaks the pattern’s downside border. After that, the market may continue falling with the potential target at $250.
Litecoin
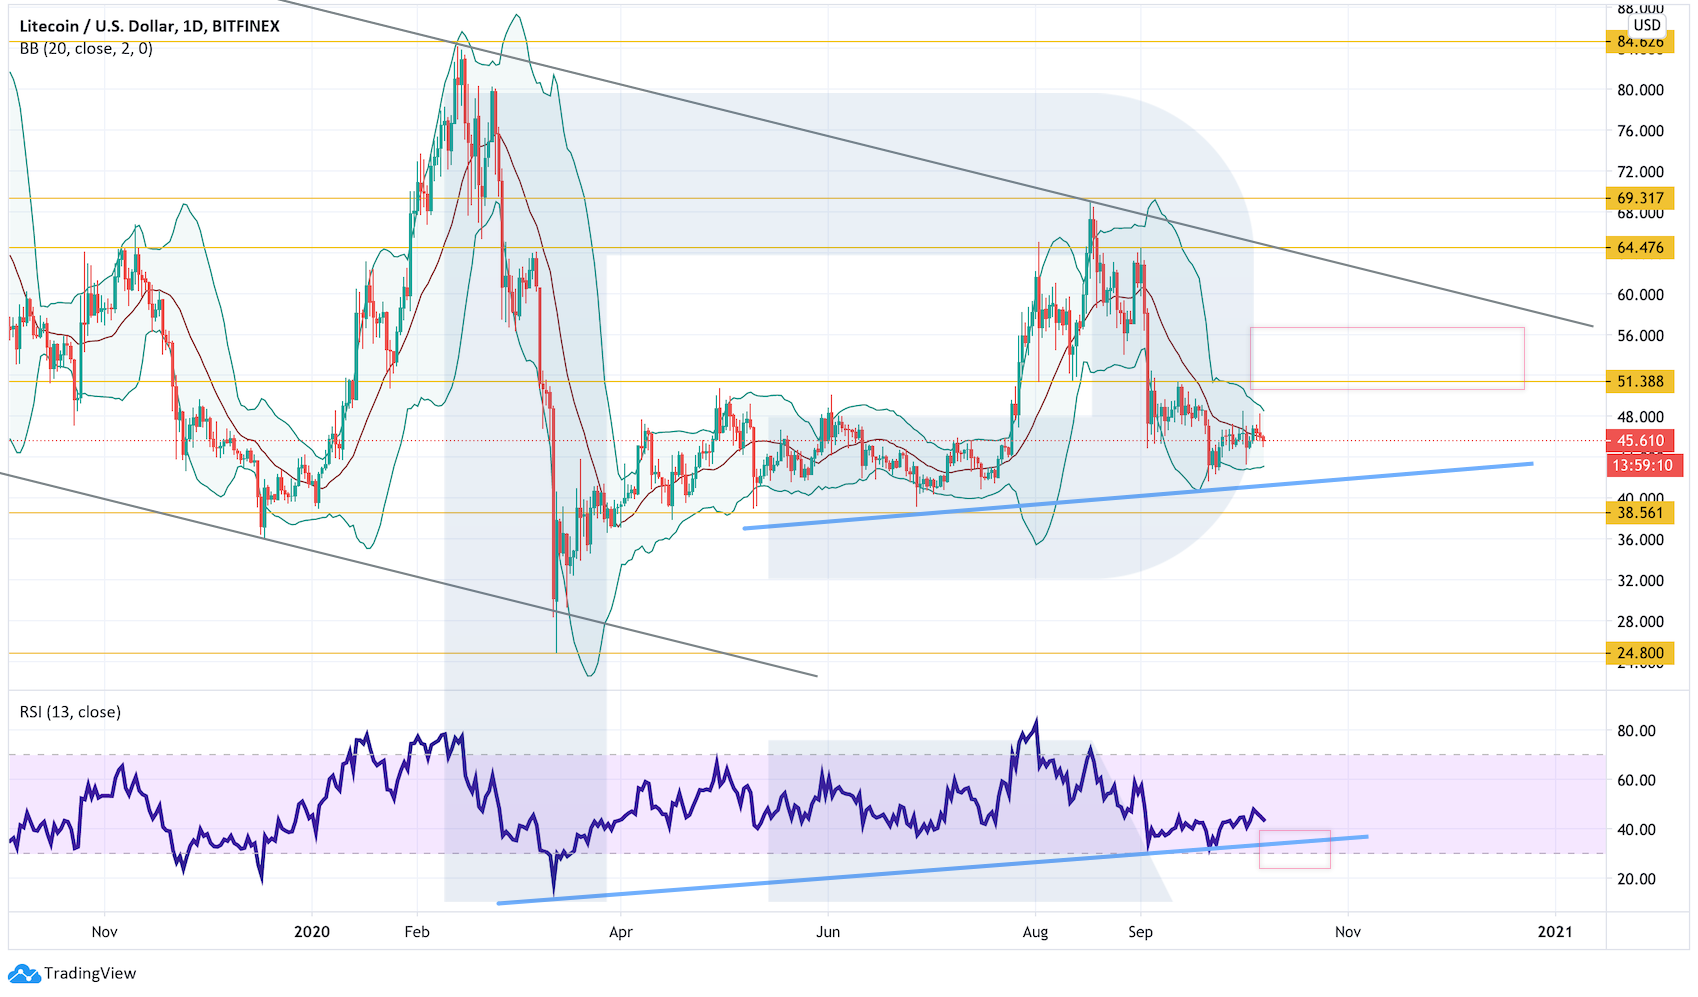
In the H4 daily chart, Litecoin continues forming a Head & Shoulders reversal pattern. The price is expected to rebound from the current level to the upside and move towards $52-55 where it may complete the right Shoulder. A signal in favor of this idea will be a rebound from the support line at the RSI. However, to cancel the pattern the asset must break $69: in this case, the pair may continue trading upwards to reach $85. Still, this scenario may be no longer be valid if the market breaks the support area and fixes below $38.50. After that, the instrument may continue falling with the target at $24.80.
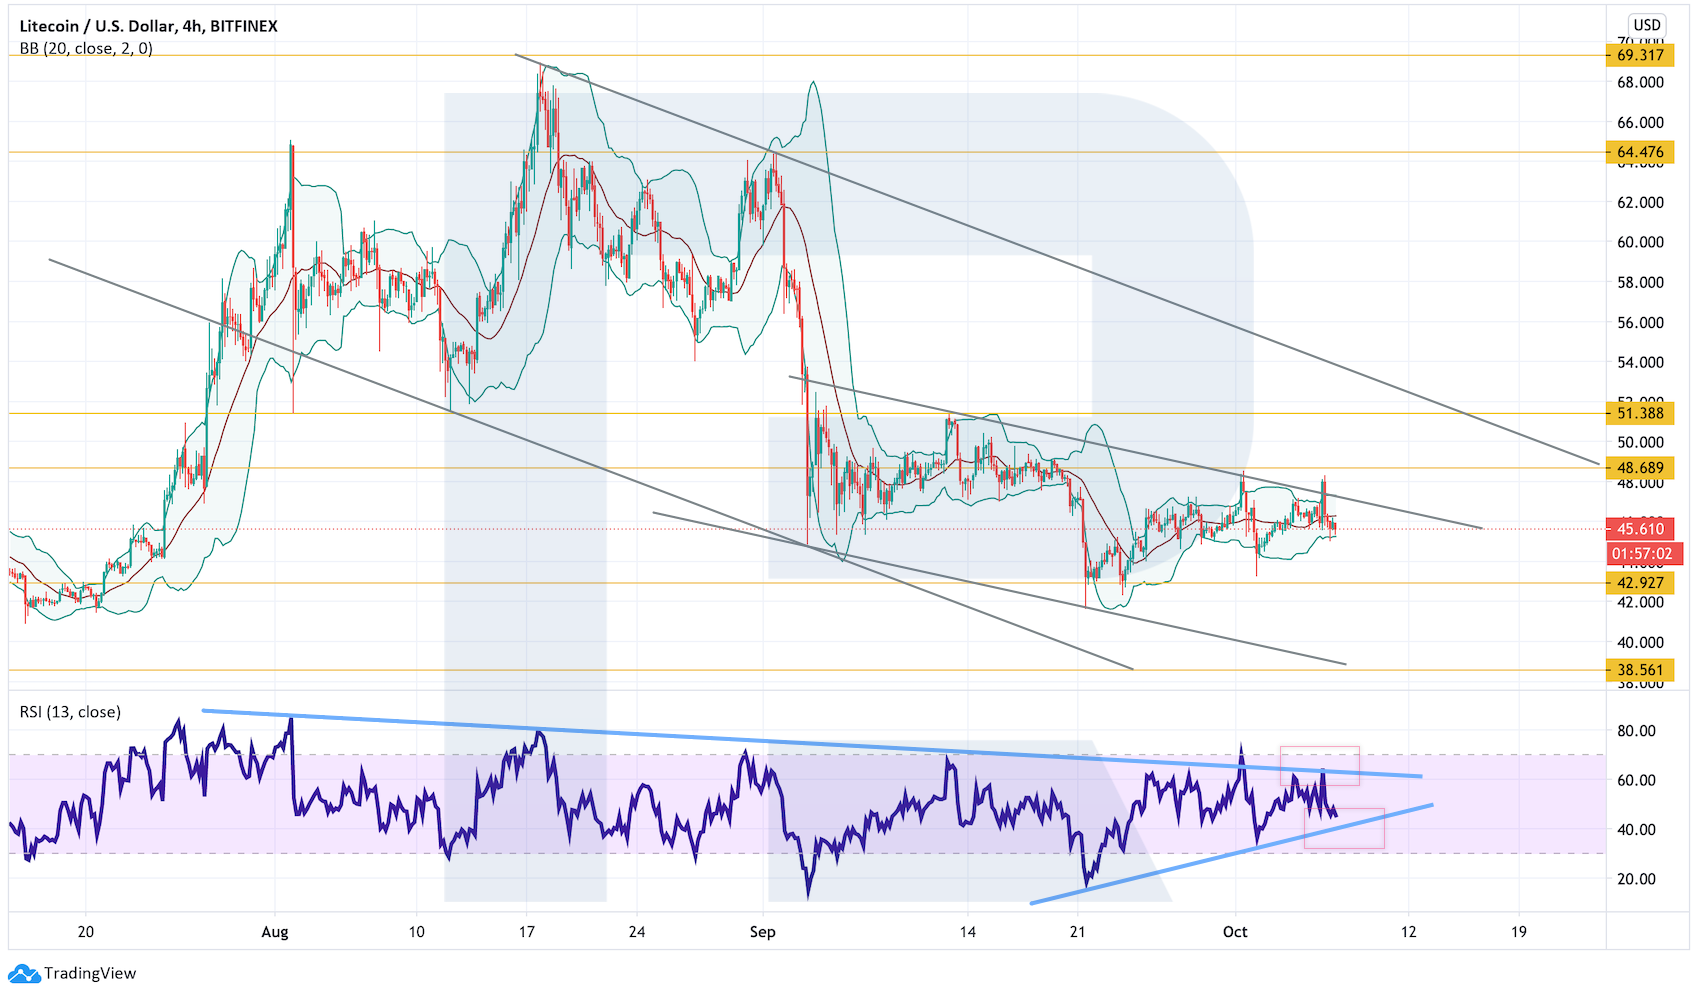
As we can see in the H4 chart, LTC/USD is rebounding from the descending channel’s upside border. There are risks of falling towards $42, a breakout of which may lead to further decline with the target at $38.50. A signal in favor of this idea is another rebound from the trendline at the RSI. However, after bulls break $49 and fix the price above it, the market may continue growing to break $52, thus leaving the descending channel.
XRP
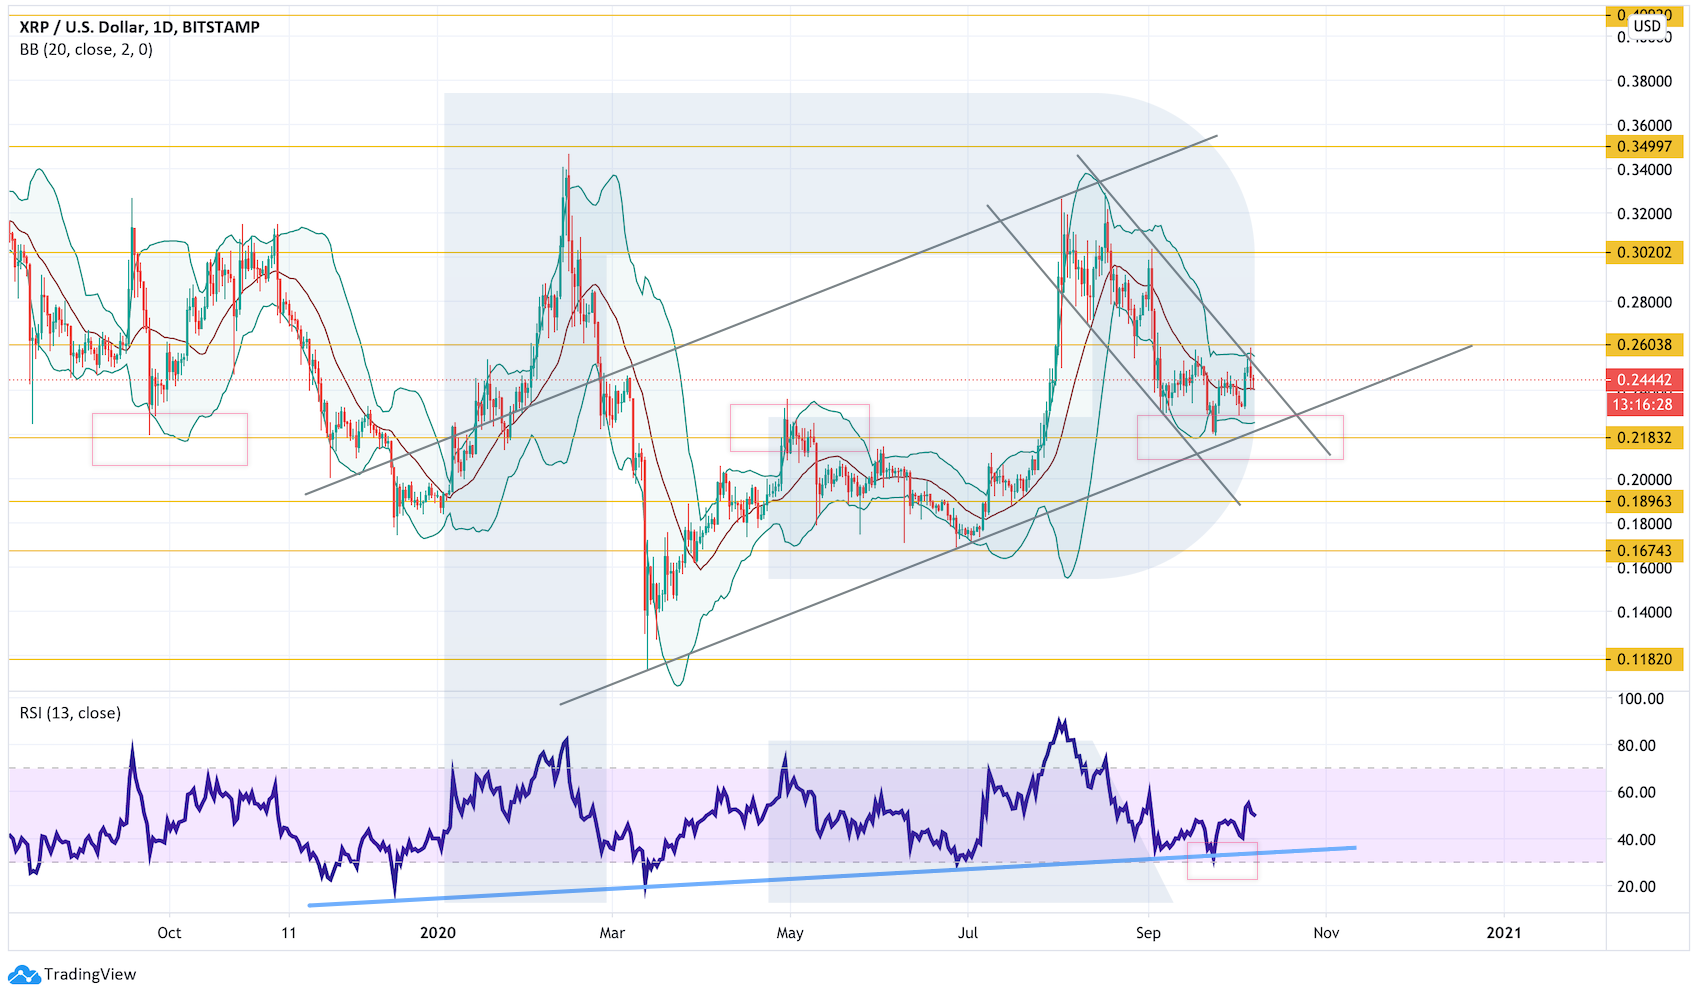
As we can see in the daily chart, XRP is trying to break the upper band of the Bollinger Bands indicator to complete the descending correction and start a new growth with the first target at $0.3020. A strong signal in favor of this idea is a rebound from the support line at the RSI. To confirm this scenario, the price must break the descending channel’s upside border and fix above $0.2605. However, this scenario may no longer be valid if the market breaks the rising channel’s downside border at $0.2180. After that, the instrument may continue trading downwards to reach $0.1675.
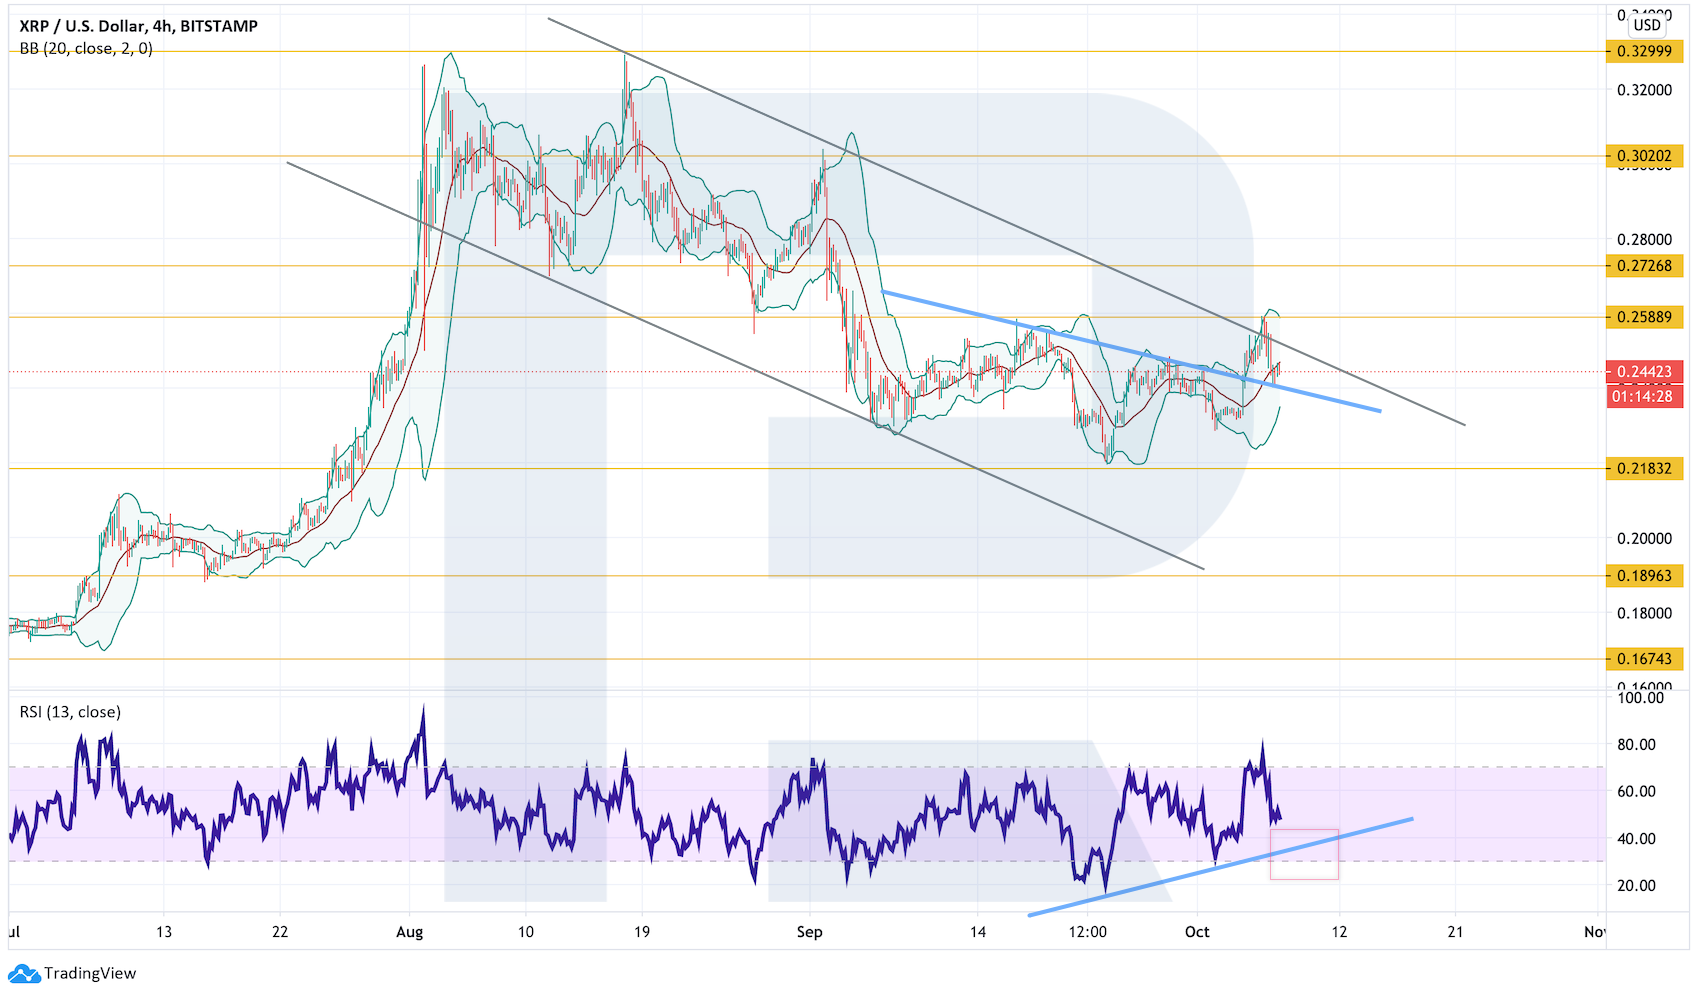
On shorter timeframes, the asset is trying to grow within the frameworks of an Inverted Head & Shoulders pattern materialization. The cryptocurrency is testing the broken neckline and might as well start growing from the current levels. A signal in favor of this idea will be a rebound from the support line at the RSI. However, this scenario may be canceled if the market falls and breaks $0.2185. In this case, the instrument may continue falling to reach $0.1895.
EOS
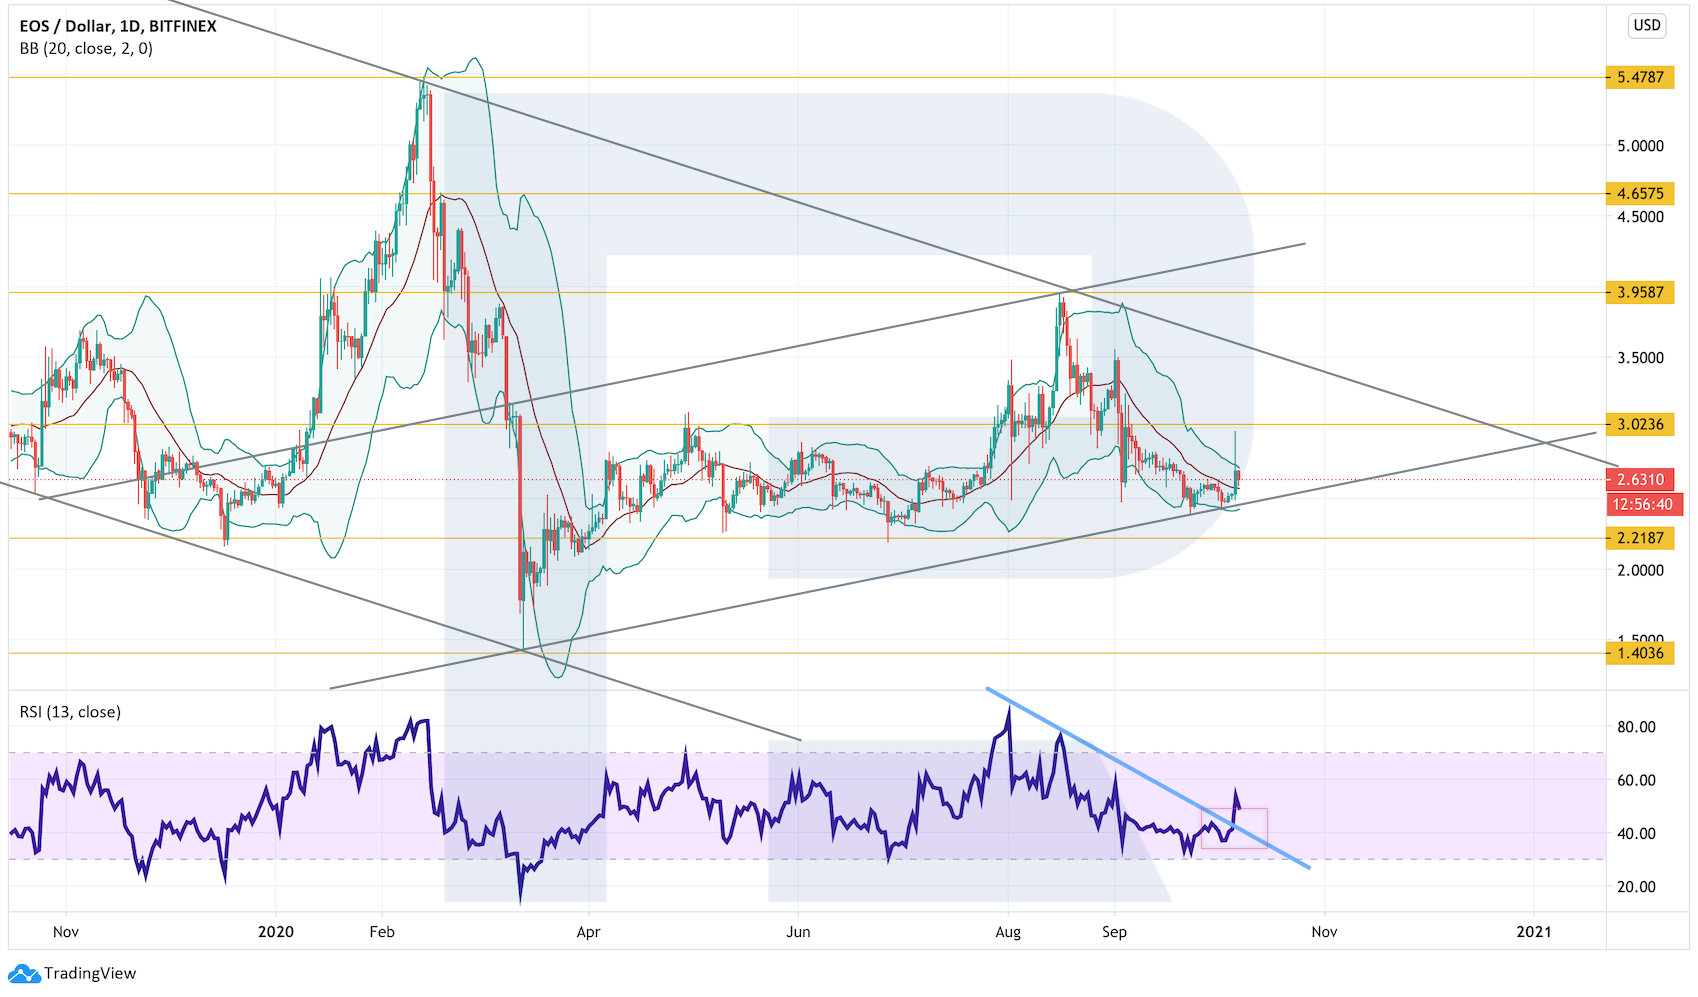
In the daily chart, EOS is rebounding from the support area and the rising channel’s downside border. A strong signal in favor of further growth with the target at $3.95 is a breakout of the descending trendline at the RSI, which indicates a potential breakout of the descending channel’s upside border. However, this scenario may no longer be valid if the market breaks the support area and fixes below $2.21. in this case, the instrument may continue trading downwards with the potential target at $1.40.
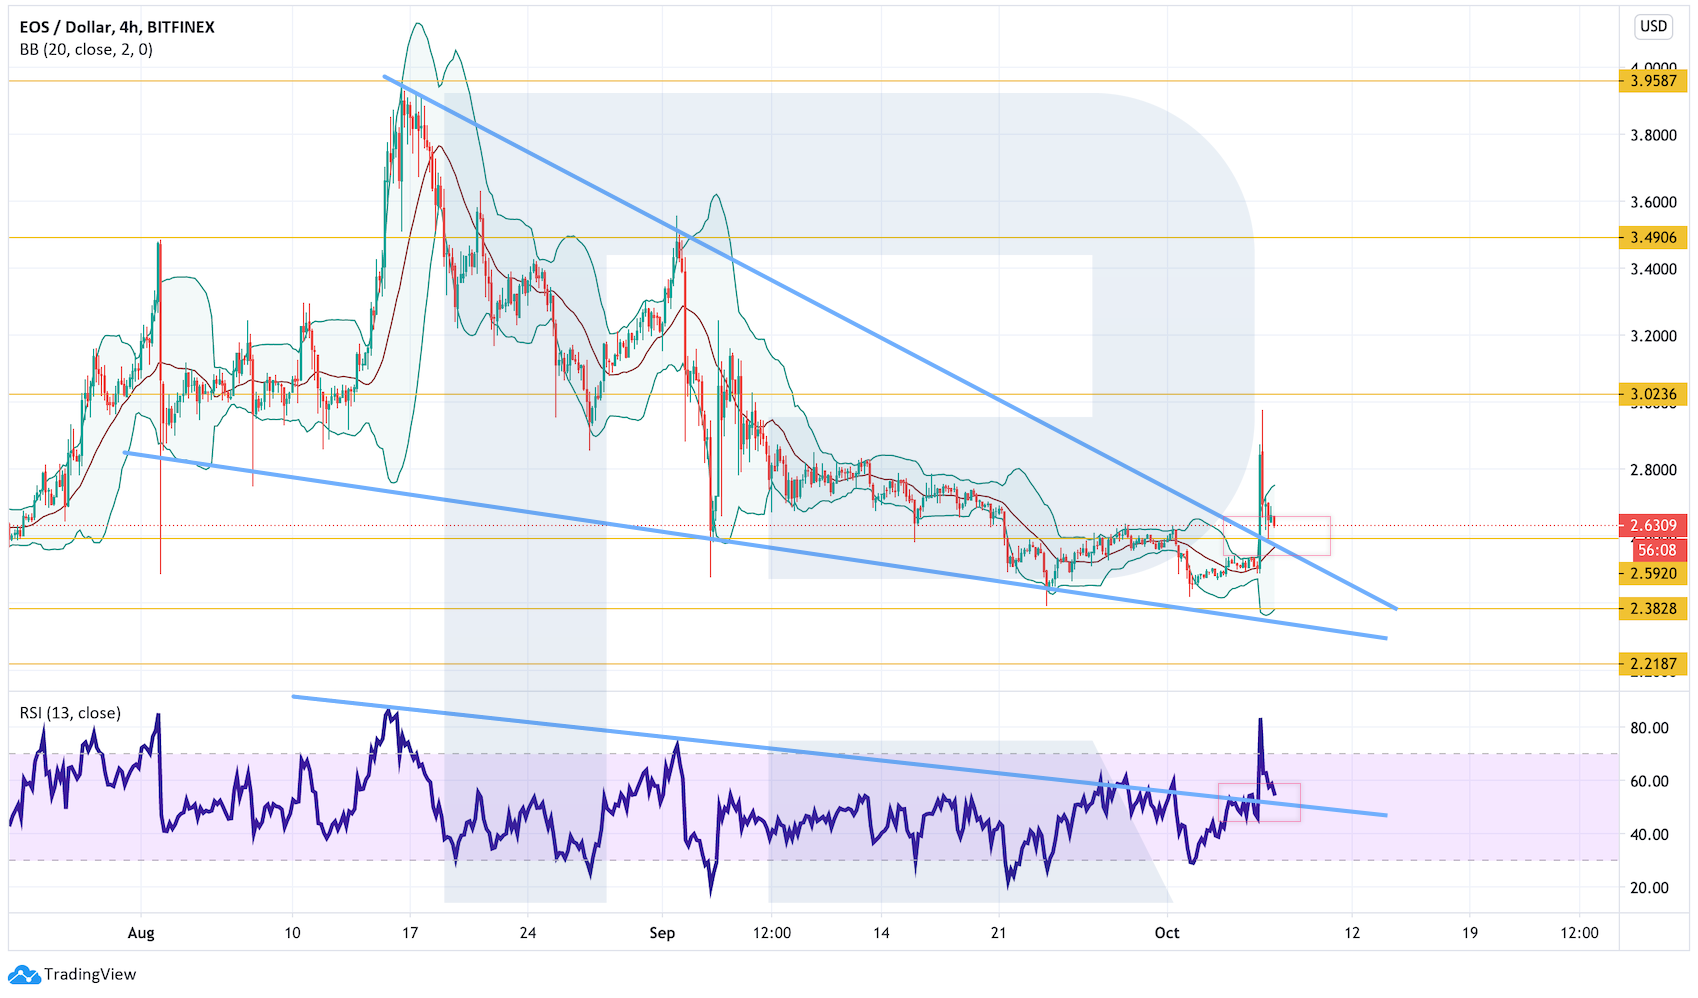
As we can see in the H4 chart, the cryptocurrency has broken a Wedge reversal pattern. In the nearest future, the asset is expected to test the pattern’s broken border and resume trading upwards with the target at $3.95. A strong signal in favor of this idea is a breakout of the descending trendline at the RSI. However, this scenario may be canceled if the market falls and breaks $2.38. After that, the instrument may continue falling to reach $2.21 or even lower.
Disclaimer
Any predictions contained herein are based on the author's particular opinion. This analysis shall not be treated as trading advice. RoboForex shall not be held liable for the results of the trades arising from relying upon trading recommendations and reviews contained herein.
© 2020 CryptoDaily All Rights Reserved. This article is provided for informational purposes only. It is not offered or intended to be used as legal, tax, investment, financial, or other advice.


By Dmitriy Gurkovskiy, Chief Analyst at RoboForex
Cryptocurrencies are correcting again and many assets are forming Triangle patterns, which indicate some uncertainty in further movements. To start growing, each asset must break the pattern’s upside border. However, if the bearish pressure is way too strong and the pattern is broken to the downside, the cryptocurrencies may continue their respective descending corrections. BTC/USD may fall towards $8,000 and complete a bullish pattern, which may be followed by further growth to reach new highs.
Bitcoin
In the daily chart, Bitcoin continues the correction between $11,200 and $10,00. In general, bulls manage to protect an important support area and one shouldn’t expect further decline as long as the price hasn’t broken $10,000. On the other hand, it’s very important for bulls to break $11,200 because in this case the asset may break the upper band of the Bollinger Bands and start a new bullish impulse. If it happens, the cryptocurrency may continue $12,495, a breakout of which may lead to a further uptrend with the target at $14,230. However, if bulls can’t protect $10,000 and bears break it, the instrument will continue falling towards $7,865 where it may complete a bullish “5-0” pattern.
As we can see in the H4 chart, BTC/USD is stuck within a Triangle pattern, which indicates that the uncertainty continues. In the nearest future, one can expect an increase in volatility and a breakout of the pattern. After breaking the pattern to the upside and fixing above $10,970, the cryptocurrency may stop falling and start new growth within the frameworks of the Triangle pattern materialization. In this case, the upside target may be at $12,070. Another signal in favor of this idea will be a rebound from the support line at the RSI. However, this scenario may be canceled if the asset breaks the pattern’s downside border and fixes below $10,100. After that, the instrument may continue falling to reach $9,040 within the frameworks of the pattern materialization.
Ethereum
As we can see in the daily chart, ETH/USD is still rebounding from the middle band of the Bollinger Bands indicator, which means that the bearish pressure continues. That’s why, one shouldn’t exclude one more attempt of another decline towards $306, which may be followed by a rebound and further growth with the potential target at $490. An additional signal in favor of this idea will be a rebound from the support line at the RSI – one can see that the previous test resulted in a rebound to the upside. However, this scenario may no longer be valid if the instrument breaks the rising channel’s downside border and fixes below $300. In this case, a bullish “5-0” pattern will be canceled and the market may continue falling with the target at $208.
On shorter timeframes, bulls weren’t to force the Double Bottom reversal pattern materialization. Right now, the cryptocurrency is moving within a Triangle pattern. There has been a rebound from the support line at the RSI, that’s why one shouldn’t exclude an attempt to grow and break the latter pattern’s upside border. As soon as bulls are able to break $397, the asset may continue trading upwards to reach $490 within the frameworks of the Triangle pattern materialization. However, this scenario may be canceled if the instrument breaks the pattern’s downside border. After that, the market may continue falling with the potential target at $250.
Litecoin
In the H4 daily chart, Litecoin continues forming a Head & Shoulders reversal pattern. The price is expected to rebound from the current level to the upside and move towards $52-55 where it may complete the right Shoulder. A signal in favor of this idea will be a rebound from the support line at the RSI. However, to cancel the pattern the asset must break $69: in this case, the pair may continue trading upwards to reach $85. Still, this scenario may be no longer be valid if the market breaks the support area and fixes below $38.50. After that, the instrument may continue falling with the target at $24.80.
As we can see in the H4 chart, LTC/USD is rebounding from the descending channel’s upside border. There are risks of falling towards $42, a breakout of which may lead to further decline with the target at $38.50. A signal in favor of this idea is another rebound from the trendline at the RSI. However, after bulls break $49 and fix the price above it, the market may continue growing to break $52, thus leaving the descending channel.
XRP
As we can see in the daily chart, XRP is trying to break the upper band of the Bollinger Bands indicator to complete the descending correction and start a new growth with the first target at $0.3020. A strong signal in favor of this idea is a rebound from the support line at the RSI. To confirm this scenario, the price must break the descending channel’s upside border and fix above $0.2605. However, this scenario may no longer be valid if the market breaks the rising channel’s downside border at $0.2180. After that, the instrument may continue trading downwards to reach $0.1675.
On shorter timeframes, the asset is trying to grow within the frameworks of an Inverted Head & Shoulders pattern materialization. The cryptocurrency is testing the broken neckline and might as well start growing from the current levels. A signal in favor of this idea will be a rebound from the support line at the RSI. However, this scenario may be canceled if the market falls and breaks $0.2185. In this case, the instrument may continue falling to reach $0.1895.
EOS
In the daily chart, EOS is rebounding from the support area and the rising channel’s downside border. A strong signal in favor of further growth with the target at $3.95 is a breakout of the descending trendline at the RSI, which indicates a potential breakout of the descending channel’s upside border. However, this scenario may no longer be valid if the market breaks the support area and fixes below $2.21. in this case, the instrument may continue trading downwards with the potential target at $1.40.
As we can see in the H4 chart, the cryptocurrency has broken a Wedge reversal pattern. In the nearest future, the asset is expected to test the pattern’s broken border and resume trading upwards with the target at $3.95. A strong signal in favor of this idea is a breakout of the descending trendline at the RSI. However, this scenario may be canceled if the market falls and breaks $2.38. After that, the instrument may continue falling to reach $2.21 or even lower.
Disclaimer
Any predictions contained herein are based on the author's particular opinion. This analysis shall not be treated as trading advice. RoboForex shall not be held liable for the results of the trades arising from relying upon trading recommendations and reviews contained herein.
© 2020 CryptoDaily All Rights Reserved. This article is provided for informational purposes only. It is not offered or intended to be used as legal, tax, investment, financial, or other advice.