Published
3 years ago on
October 27, 2020
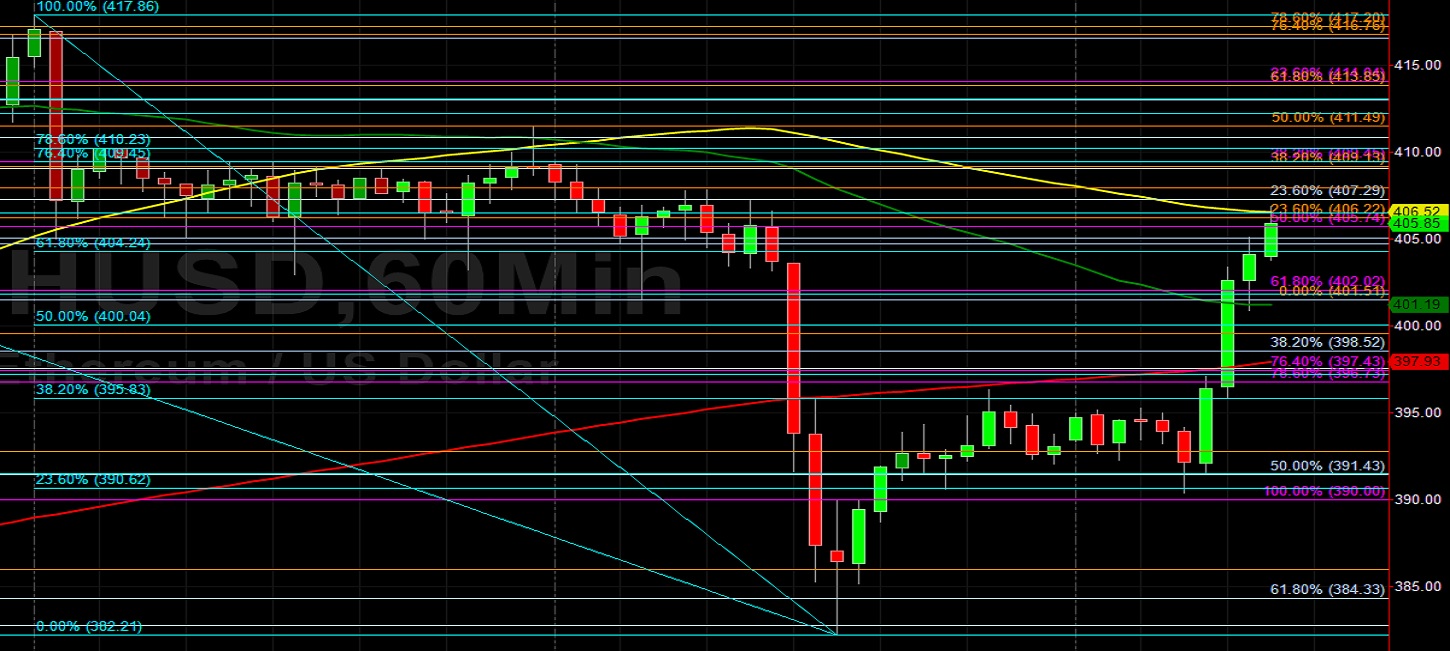
Ethereum (ETH/USD) extended its recent recovery early in today’s North American session as the pair appreciated to the 405.08 area after trading as low as the 390.35 area during the European session, just below the 390.62 area that represents the 23.6% retracement of the recent depreciating range from 417.86 to 382.21. Stops were then elected above additional retracement levels related to that depreciating range, including the 395.83, 400.04, and 404.24 levels. The 409.45 and 410.23 areas are additional upside retracement levels in this depreciating range. Traders are also monitoring the broader depreciating range from 421.47 to 382.21, and observed that Stops were triggered above related retracement levels including 391.48, 397.21, and 401.84. Additional retracement levels in this depreciating range include 406.47, 412.20, and 413.07. One appreciating range that traders continue to monitor is the ascent from 364.04 to 421.47, with the 407.92, 399.53, 392.76, and 385.98 areas representing important retracement levels. Stops were recently elected above the 378.85 and 399.87 levels during the pair’s ascent, representing the 38.2% and 50% retracements of the recent depreciating range from 488.95 to 310.79. Traders are also observing that the 100-hour simple moving average just bearishly moved above the 50-hour simple moving average, and this could result in additional market weakness.
Additional upside price objectives include 420.89, 425.31, 427.78, 437.41, and 446.90. Following ETH/USD’s run-up, traders are paying close attention to the 403.11, 395.14, 388.69, 382.84, and 374.27 levels as areas of potential technical support. Additional areas of potential upside pressure include the 393.37, 379.37, and 368.05 levels. The 396.69 area remains an important technical level, representing the 23.6% retracement of the historical depreciation from 1419.96 to 80.60, and traders are curious to see if ETH/USD can maintain this level. Traders are observing that the 50-bar MA (4-hourly) is bullishly indicating above the 100-bar MA (4-hourly) and above the 200-bar MA (4-hourly). Also, the 50-bar MA (hourly) is bearishly indicating below the 100-bar MA (hourly) and above the 200-bar MA (hourly).
Price activity is nearest the 50-bar MA (4-hourly) at 398.29 and the 100-bar MA (Hourly) at 406.52.
Technical Support is expected around 315.08/ 302.20/ 279.77 with Stops expected below.
Technical Resistance is expected around 421.47/ 437.41/ 454.79 with Stops expected above.
On 4-Hourly chart, SlowK is Bullishly above SlowD while MACD is Bearishly below MACDAverage.
On 60-minute chart, SlowK is Bullishly above SlowD while MACD is Bullishly above MACDAverage.
Investment Disclaimer