Published
3 years ago on
November 20, 2020
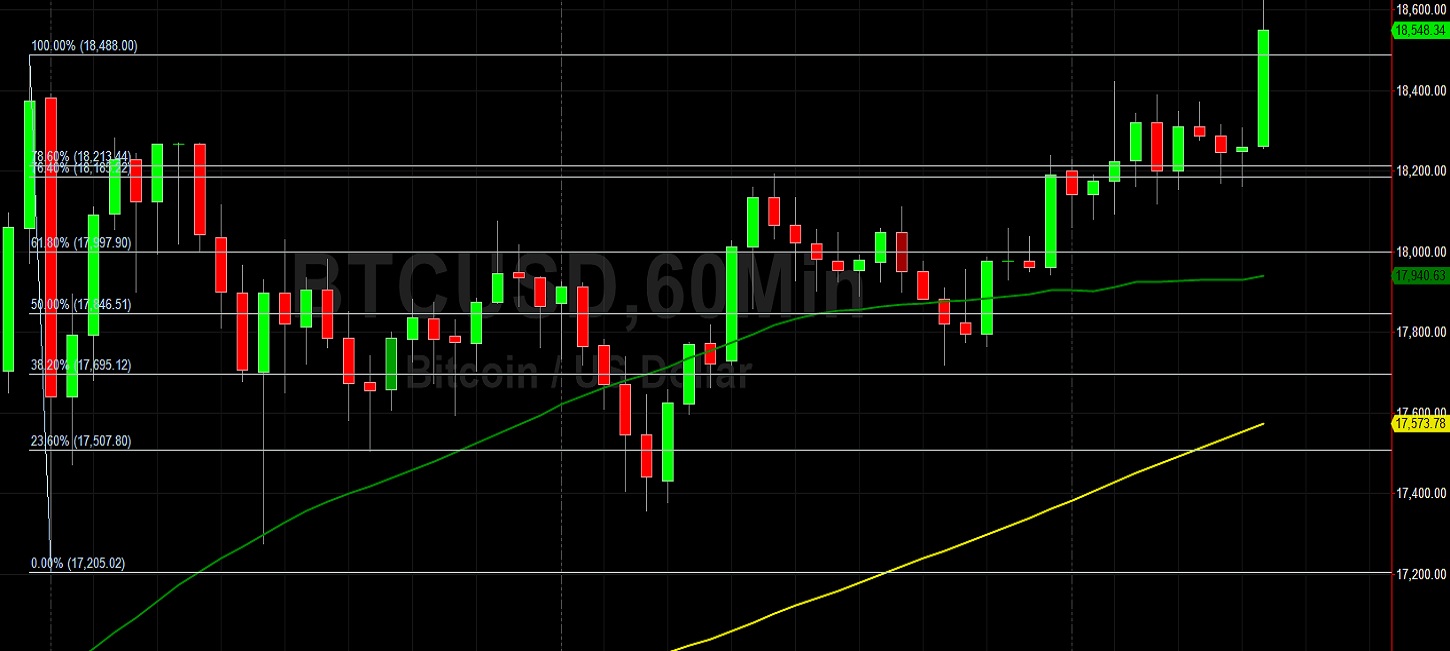
Bitcoin (BTC/USD) gained strong ground early in today’s North American session as the pair appreciated to the 18421.63 area after trading as low as the 17719.24 level in the Asian session, just above the 17695.12 area that represents the 38.2% retracement of the recent depreciating range from 18488 to 17205.02. Traders are paying close attention to see if BTC/USD is able to test and move above its recent multi-year high of 18488. One important level that traders are focusing on is the 19496.91 level, an upside price objective related to buying demand that emerged early this year around the 6865 area. Other upside price objective that traders are carefully watching are the 20311.36 and 21909.24 areas, related to buying demand that emerged around the 6430 area earlier this year. Similarly, the 20534.46 area is an upside price objective related to buying demand that originated earlier this year around the 6854.67 area.
Traders will pay close attention to some potential areas of technical support during pullbacks lower and these include the 17657.16, 17306.03, 16304.69, 16092.69, and 15935.90 areas. Notably, the 15935.90 and 16304.69 areas represent the 76.4% and 78.6% retracements of a historical depreciation from 19891.99 to 3128.89. Further below current market activity, traders are paying close attention to additional potential areas of technical support during pullbacks and these include the 14273.50, 14259.01, 14101.50, 13989.55, 13892.29, 13705.50, 13663.43, and 13594.42 levels. Chartists are observing that the 50-bar MA (4-hourly) is bullishly indicating above the 100-bar MA (4-hourly) and above the 200-bar MA (4-hourly). Also, the 50-bar MA (hourly) is bullishly indicating above the 100-bar MA (hourly) and above the 200-bar MA (hourly).
Price activity is nearest the 50-bar MA (4-hourly) at 16897.87 and the 50-bar MA (Hourly) at 17941.20.
Technical Support is expected around 17657.16/ 17306.03/ 16304.69 with Stops expected below.
Technical Resistance is expected around 19496.91/ 20311.36/ 21909.24 with Stops expected above.
On 4-Hourly chart, SlowK is Bullishly above SlowD while MACD is Bullishly above MACDAverage.
On 60-minute chart, SlowK is Bullishly above SlowD while MACD is Bullishly above MACDAverage.
Investment Disclaimer