Published
3 years ago on
November 30, 2020
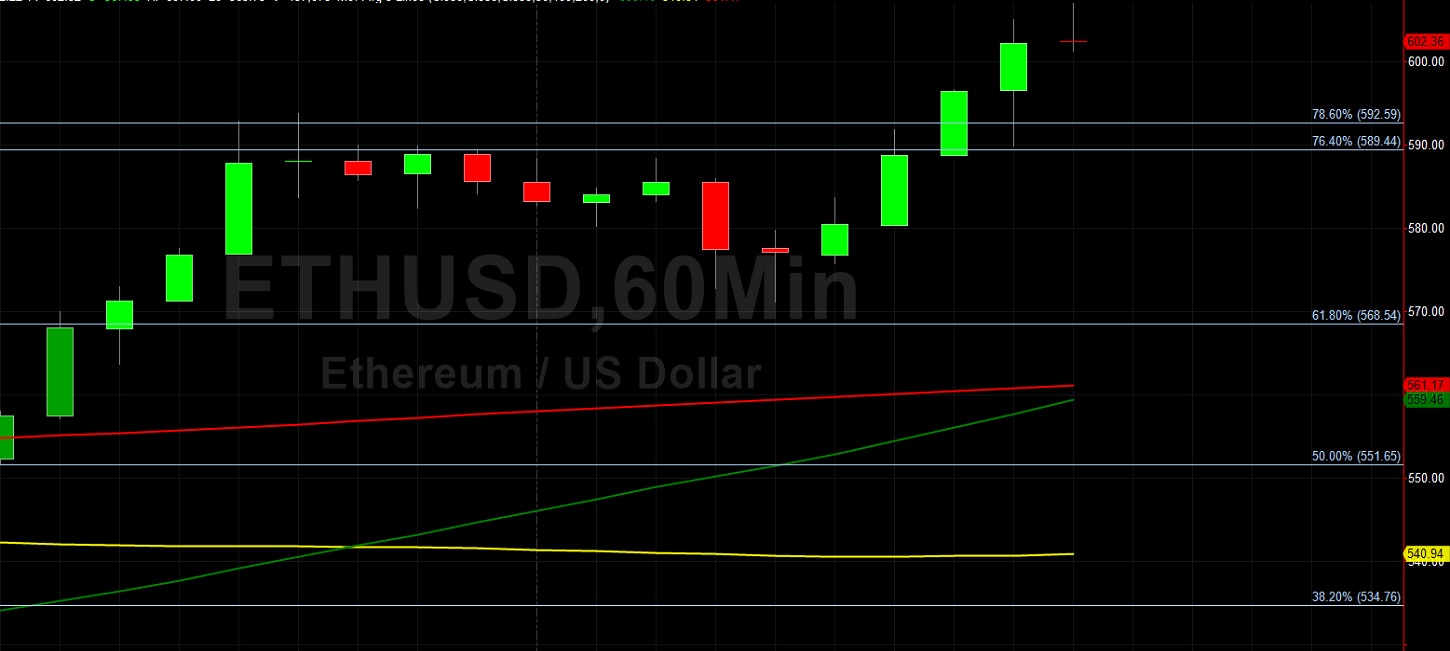
Ethereum (ETH/USD) extended recent gains early in today’s North American session as the pair appreciated to the 605.00 area after trading as low as the 557.21 area in the Asian session. Stops were elected above the 568.54, 589.44, and 596.11 areas during the appreciation, upside retracement levels related to the recent depreciating range from 623.22 to 480.08. Prior to the depreciation, ETH/USD had been hovering around the 551.65 area, representing the 50% retracement of the depreciating range. Traders are waiting to see if ETH/USD will appreciate to establish another multi-year high. Traders are also paying close attention to technical resistance around the 627.83, 638.28, and 652.36 areas. The pair’s recent pullback was a test of the 479.03 area, representing the 78.6% retracement of the appreciating range from 439.77 to 623.22. One level that traders are carefully monitoring is the 503.57 area, a level that represents the 38.2% retracement of the recent appreciating range from 310.00 to 623.22, and price activity was recently buoyed above this area. Stops were recently elected below a series of retracement levels including 579.73, 563.58, 553.14, 531.50, 526.88, 509.85, 496.86, and 483.06. Larger Stops were elected below the 550.01 and 504.72 areas, retracement levels related to the wider appreciating range from 313.00 to 623.22. On the upside, Stops were recently elected above the 615.19 area during the climb higher, an upside price objective related to buying activity that originated around the 142.10 level earlier this year. The pair’s next upside price objectives include the 637.79, 668.87, 679.78, and 698.88 levels.
Stops were also recently elected above the 583.59 and 592.24 areas during the ascent, retracement levels related to selling pressure that commenced around the 894.50 and 1419.96 levels. Stops were also recently elected above the 519.16, 521.13, 524.97, and 540.64 areas during the ascent higher, preceded by Stops triggered above the 503.54, 508.69, and 510.22 levels. During pullbacks lower, traders are paying close attention to the pair’s trading activity around the 461.31 area, an upside price objective related to buying pressure that emerged months ago around the 125.52 area. Some additional downside retracement levels include 432.71, 431.36, 427.78, 424.14, 422.81, 419.74, 415.20, 411.91, and 408.12. Additional areas of potential downside support include the 400.56, 395.87, 387.62, 380.03, 377.17, 367.24, 366.72, 354.44, and 353.78 areas. Traders are observing that the 50-bar MA (4-hourly) is bullishly indicating above the 100-bar MA (4-hourly) and above the 200-bar MA (4-hourly). Also, the 50-bar MA (hourly) is bearishly indicating below the 100-bar MA (hourly) and below the 200-bar MA (hourly).
Price activity is nearest the 50-bar MA (4-hourly) at 561.55 and the 200-bar MA (Hourly) at 561.17.
Technical Support is expected around 417.60/ 388.49/ 366.72 with Stops expected below.
Technical Resistance is expected around 627.83/ 637.79/ 668.87 with Stops expected above.
On 4-Hourly chart, SlowK is Bullishly above SlowD while MACD is Bullishly above MACDAverage.
On 60-minute chart, SlowK is Bullishly above SlowD while MACD is Bullishly above MACDAverage.
Investment Disclaimer