Published
3 years ago on
November 25, 2020
Ethereum (ETH/USD) faded lower early in today’s North American session as the pair depreciated to the 594.79 area after trading as high as the 606.61 area in the Asian session. The pair retreated to the 579.35 area during the European session after Stops were elected below the 580.41 area, representing the 38.2% retracement of the appreciating range from 511.16 to 623.22. Notably, the intraday low represented a test of the 23.6% retracement of the appreciating range from 439.77 to 623.22. The next downside retracement levels in this recent appreciating range include 567.19, 553.97, 537.61, and 535.14. Traders are monitoring the intraday depreciating range from 623.22 to 579.35 where some relevant retracement levels include 589.70, 596.11, 601.29, 606.46, and 612.87. Stops were recently elected above the 615.19 area during the climb higher, an upside price objective related to buying activity that originated around the 142.10 level earlier this year. The pair’s next upside price objectives include the 637.79, 668.87, 679.78, and 698.88 levels. Traders are also paying close attention to technical resistance around the 627.83, 638.28, and 652.36 areas.
Stops were recently elected above the 583.59 and 592.24 areas during the ascent, retracement levels related to selling pressure that commenced around the 894.50 and 1419.96 levels. Stops were also recently elected above the 519.16, 521.13, 524.97, and 540.64 areas during the ascent higher, preceded by Stops triggered above the 503.54, 508.69, and 510.22 levels. During pullbacks lower, traders are paying close attention to the pair’s trading activity around the 461.31 area, an upside price objective related to buying pressure that emerged months ago around the 125.52 area. Some additional downside retracement levels include 432.71, 431.36, 427.78, 424.14, 422.81, 419.74, 415.20, 411.91, and 408.12. Additional areas of potential downside support include the 400.56, 395.87, 387.62, 380.03, 377.17, 367.24, 366.72, 354.44, and 353.78 areas. Traders are observing that the 50-bar MA (4-hourly) is bullishly indicating above the 100-bar MA (4-hourly) and above the 200-bar MA (4-hourly). Also, the 50-bar MA (hourly) is bullishly indicating above the 100-bar MA (hourly) and above the 200-bar MA (hourly).
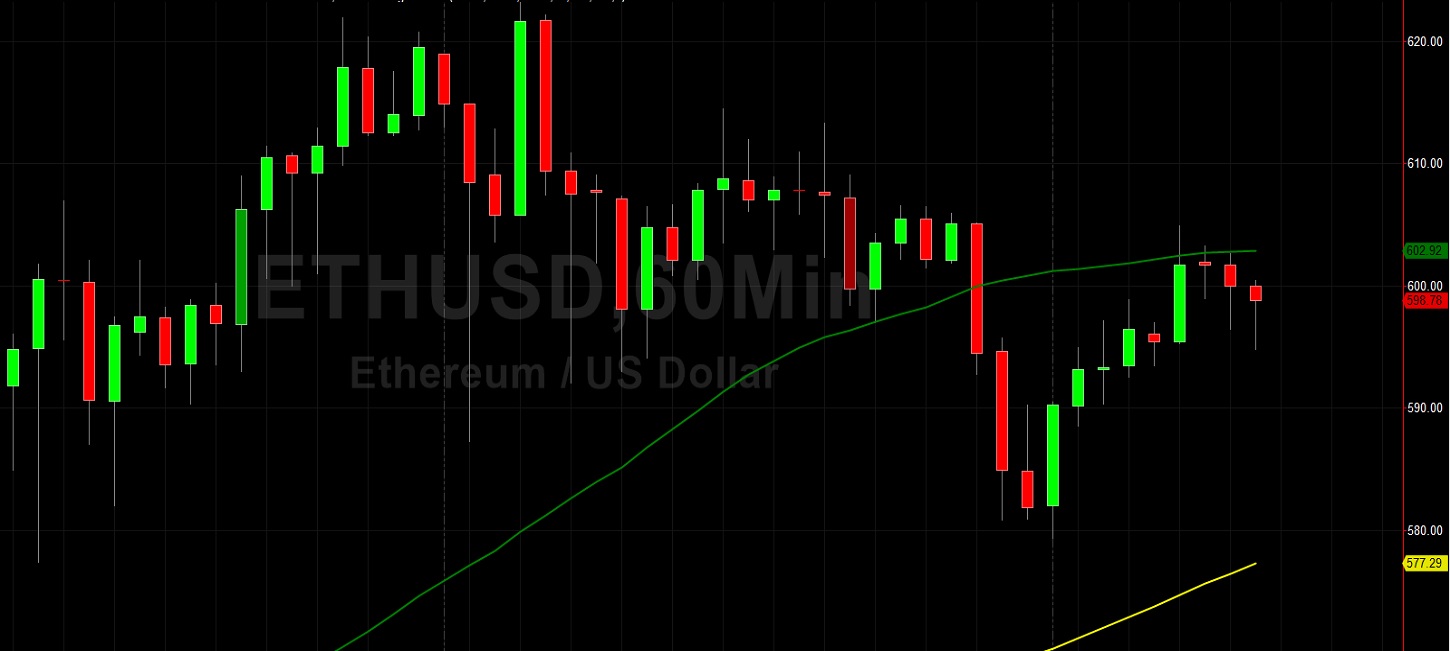
Price activity is nearest the 50-bar MA (4-hourly) at 534.55 and the 50-bar MA (Hourly) at 602.91.
Technical Support is expected around 417.60/ 388.49/ 366.72 with Stops expected below.
Technical Resistance is expected around 627.83/ 637.79/ 668.87 with Stops expected above.
On 4-Hourly chart, SlowK is Bearishly below SlowD while MACD is Bearishly below MACDAverage.
On 60-minute chart, SlowK is Bullishly above SlowD while MACD is Bullishly above MACDAverage.
Investment Disclaimer