Published
3 years ago on
December 13, 2020
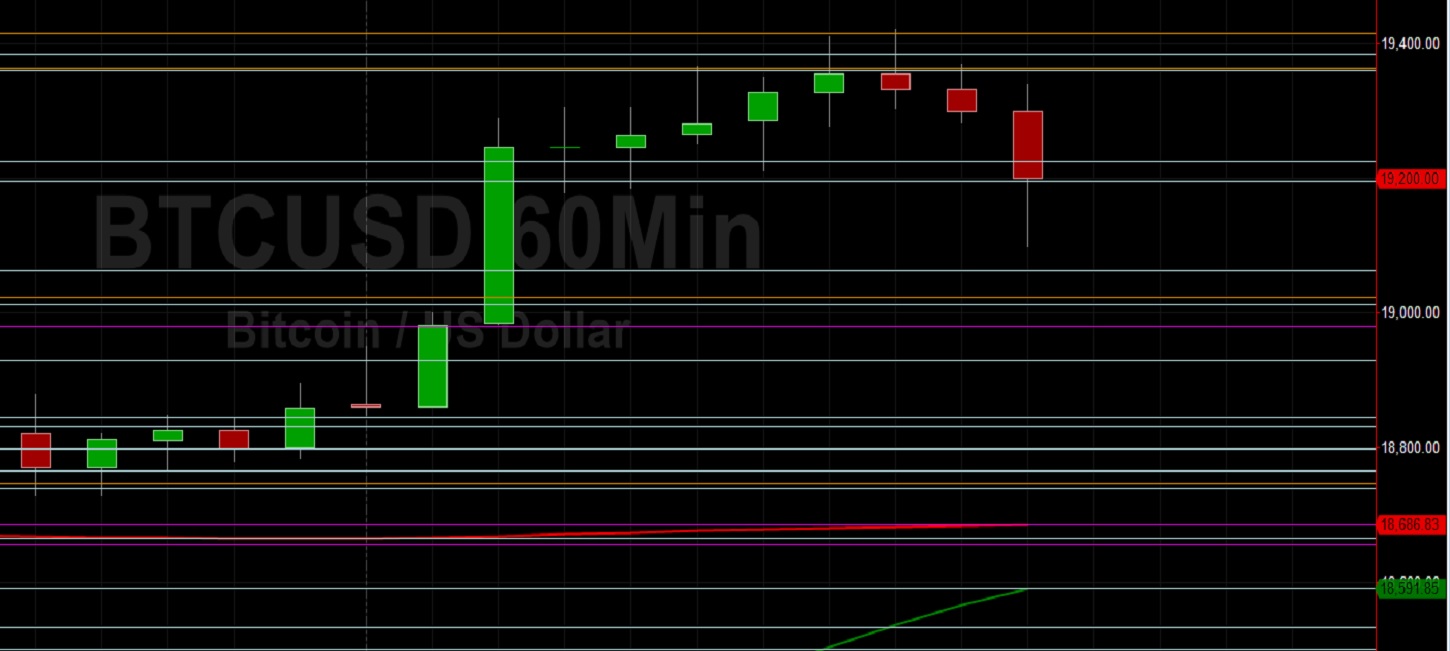
Bitcoin (BTC/USD) weakened early in today’s North American as the pair fell to the 19100 area after trading as high as the 19421.03 level, representing a test of the 78.6% retracement of the depreciating range from the recent all-time high of 19915.14 to 17580.00. Strong buying activity during the Asian session saw BTC/USD maintain a foothold above the 200-hour simple moving average, and move back above its 100-bar 4-hourly and 200-bar 4-hourly simple moving averages. Traders are closely monitoring BTC/USD to see if it will test the psychologically-important 20000 figure after eclipsing the previous all-time high of 19891.99. Traders drove BTC/USD lower to test the 17580.00 level last week, representing a test of the 61.8% retracement of the recent appreciating range from 16200 to 19915.14. During the pullback this past week, Stops were elected below the 18057.57 area, representing the 50% retracement of the appreciating range.
Below recent price activity, potential areas of technical support include the 17355.69, 17315.28, 17112.57, 17076.77, 16995.04, 16701.07, 16608.52, 16565.07, and 16451.16 levels. Above current price activity, additional upside price objectives include the 20311.36, 20534.46, and 21909.24 areas, levels that relate to buying pressure that emerged earlier this year around the 6430.00 and 6854.67 areas. Traders are observing that the 50-bar MA (4-hourly) is bullishly indicating above the 100-bar MA (4-hourly) and above the 200-bar MA (4-hourly). Also, the 50-bar MA (hourly) is bearishly indicating below the 200-bar MA (hourly) and above the 100-bar MA (hourly).
Price activity is nearest the 50-bar MA (4-hourly) at 18686.86 and the 200-bar MA (Hourly) at 18686.77.
Technical Support is expected around 16200/ 15996.17/ 15479.66 with Stops expected below.
Technical Resistance is expected around 19915.14/ 20311.36/ 21909.24 with Stops expected above.
On 4-Hourly chart, SlowK is Bearishly below SlowD while MACD is Bullishly above MACDAverage.
On 60-minute chart, SlowK is Bearishly below SlowD while MACD is Bullishly above MACDAverage.
Investment DisclaimerFoundation: A New Trading Paradigm
Bitrue to List Hummingbot Governance Token (HBOT)