Published
3 years ago on
December 16, 2020
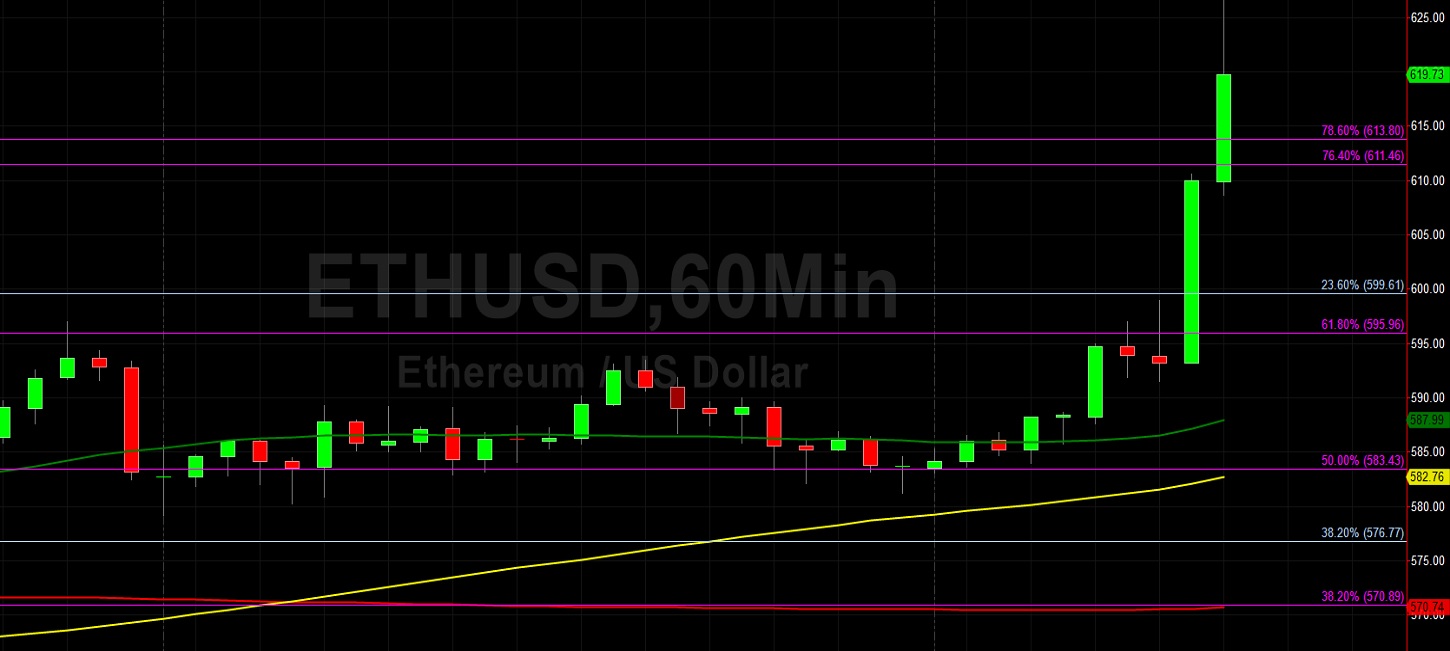
Ethereum (ETH/USD) scored strong gains early in today’s North American session as the pair moved higher to the 626.66 area after trading as low as the 581.21 area during the Asian session. Stops were elected above the 611.46 and 613.80 areas during the rapid climb, upside price objectives related to the recent depreciating range from 636.53 to 530.22. Traders are curious to see if ETH/USD has the strength to challenge the recent multi-year high of 636.53. The pair this week found technical support just below the 576.77 area during the European and North American sessions, a level that represents the 38.2% retracement of the appreciating range from 480.08 to 636.53. Stops were recently elected above the 583.43 area during the appreciation, representing the 50% retracement of the depreciating range from 636.53 to 530.32.
This recent multi-year high around the 636.53 area represented a test of the 637.79 level, an upside price objective related to buying pressure that emerged earlier this year around the 135.12 area. One key range that traders continue to watch is the recent appreciation from 480.08 to 636.53. Below recent price activity, potential areas of technical support include the 517.00, 513.56, 474.77, 460.77, 427.76, and 406.48 levels. Above current price activity, additional upside price objectives include the 668.87, 679.78, and 698.88 areas, levels that relate to buying pressure that emerged earlier this year around the 125.52, 122.15, and 116.25 areas. Traders are observing that the 50-bar MA (4-hourly) is bearishly indicating below the 100-bar MA (4-hourly) and above the 200-bar MA (4-hourly). Also, the 50-bar MA (hourly) is bullishly indicating above the 100-bar MA (hourly) and above the 200-bar MA (hourly).
Price activity is nearest the 100-bar MA (4-hourly) at 583.15 and the 50-bar MA (Hourly) at 587.97.
Technical Support is expected around 417.60/ 388.49/ 366.72 with Stops expected below.
Technical Resistance is expected around 637.79/ 668.87/ 679.78 with Stops expected above.
On 4-Hourly chart, SlowK is Bullishly above SlowD while MACD is Bullishly above MACDAverage.
On 60-minute chart, SlowK is Bullishly above SlowD while MACD is Bullishly above MACDAverage.
Investment Disclaimer