Published
3 years ago on
December 12, 2020
Ethereum (ETH/USD) was slightly weaker early in today’s North American session as the pair faded to the 555.52 area after trading as high as the 561.09 area during the Asian session. ETH/USD has been on the defensive since peaking around the 636.53 area in late November, with traders driving the pair lower to the 530.32 area this past week. This recent multi-year high around the 636.53 area represented a test of the 637.79 level, an upside price objective related to buying pressure that emerged earlier this year around the 135.12 area. One key range that traders continue to watch is the recent appreciation from 480.08 to 636.53. During a pullback this past week, some Stops were elected below the 539.84 area, representing the 61.8% retracement of the appreciating range. ETH/USD then encountered technical resistance just above the 576.66 level, representing the 38.2% retracement of the same appreciating range.
The pair has been trading below the 200-hour simple moving average for several trading sessions, evidence of the pair’s recent bearishness, and is now orbiting its 100-hour simple moving average. Below recent price activity, potential areas of technical support include the 517.00, 513.56, 474.77, 460.77, 427.76, and 406.48 levels. Above current price activity, additional upside price objectives include the 668.87, 679.78, and 698.88 areas, levels that relate to buying pressure that emerged earlier this year around the 125.52, 122.15, and 116.25 areas. Traders are observing that the 50-bar MA (4-hourly) is bearishly indicating below the 100-bar MA (4-hourly) and above the 200-bar MA (4-hourly). Also, the 50-bar MA (hourly) is bearishly indicating below the 100-bar MA (hourly) and below the 200-bar MA (hourly).
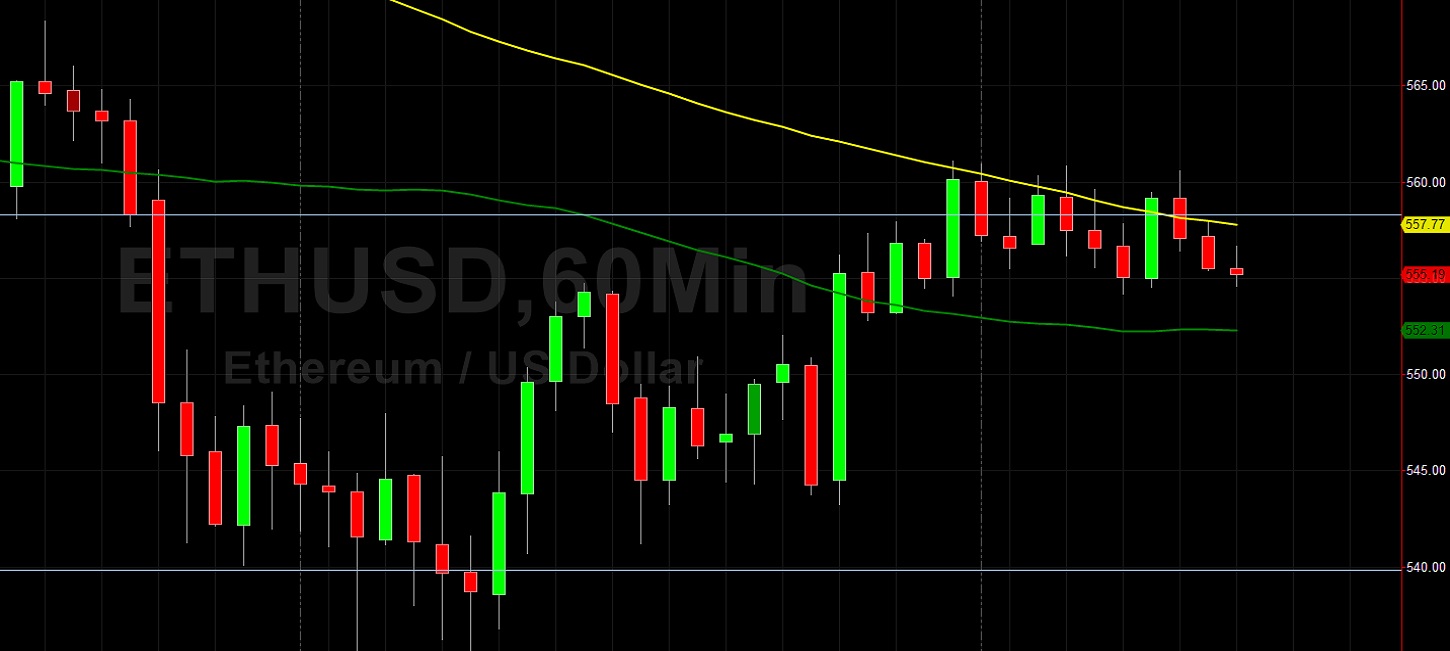
Price activity is nearest the 100-bar MA (4-hourly) at 571.49 and the 100-bar MA (Hourly) at 557.78.
Technical Support is expected around 417.60/ 388.49/ 366.72 with Stops expected below.
Technical Resistance is expected around 637.79/ 668.87/ 679.78 with Stops expected above.
On 4-Hourly chart, SlowK is Bullishly above SlowD while MACD is Bullishly above MACDAverage.
On 60-minute chart, SlowK is Bearishly below SlowD while MACD is Bearishly below MACDAverage.
Investment Disclaimer