Published
3 years ago on
December 01, 2020
Ethereum (ETH/USD) reclaimed some lost ground early in today’s North American session as the pair appreciated to the 619.70 area after trading as low as the 563.01 area earlier in the North American session, just below the 200-hour simple moving average. The pair spiked to the 636.53 level during the European session, a fresh multi-year high, after Stops were elected above the 623.22 area, a recent relative multi-year high. Stops were also triggered above the 627.83 area, an upside price objective related to historical buying pressure around the 80.60 area. Chartists are carefully monitoring retracement levels following the climb to the recent multi-year high, and these include the 599.61 and 576.77 areas, below which Stops were elected today. Additional retracement levels include 558.31, 539.84, and 517.00. Additional upside price objectives include the 638.28 and 652.36 levels. The pair’s recent pullback was a test of the 479.03 area, representing the 78.6% retracement of the appreciating range from 439.77 to 623.22. One level that traders are carefully monitoring is the 503.57 area, a level that represents the 38.2% retracement of the recent appreciating range from 310.00 to 623.22, and price activity was recently buoyed above this area.
Stops were recently elected below a series of retracement levels including 579.73, 563.58, 553.14, 531.50, 526.88, 509.85, 496.86, and 483.06. Larger Stops were elected below the 550.01 and 504.72 areas, retracement levels related to the wider appreciating range from 313.00 to 623.22. On the upside, Stops were recently elected above the 615.19 area during the climb higher, an upside price objective related to buying activity that originated around the 142.10 level earlier this year. The pair’s next upside price objectives include the 637.79, 668.87, 679.78, and 698.88 levels. Stops were also recently elected above the 583.59 and 592.24 areas during the ascent, retracement levels related to selling pressure that commenced around the 894.50 and 1419.96 levels. Stops were also recently elected above the 519.16, 521.13, 524.97, and 540.64 areas during the ascent higher, preceded by Stops triggered above the 503.54, 508.69, and 510.22 levels. Traders are observing that the 50-bar MA (4-hourly) is bullishly indicating above the 100-bar MA (4-hourly) and above the 200-bar MA (4-hourly). Also, the 50-bar MA (hourly) is bullishly indicating below the 100-bar MA (hourly) and above the 200-bar MA (hourly).
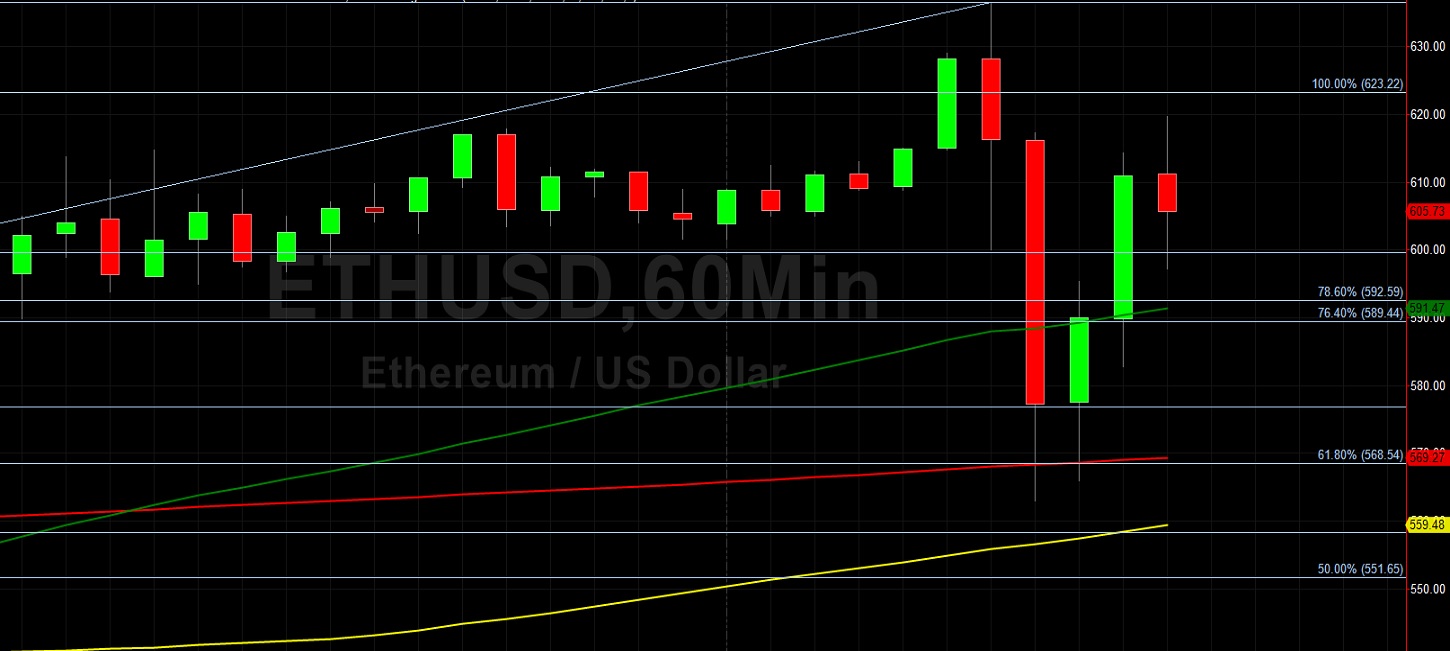
Price activity is nearest the 50-bar MA (4-hourly) at 568.03 and the 50-bar MA (Hourly) at 591.46.
Technical Support is expected around 417.60/ 388.49/ 366.72 with Stops expected below.
Technical Resistance is expected around 637.79/ 668.87/ 679.78 with Stops expected above.
On 4-Hourly chart, SlowK is Bearishly below SlowD while MACD is Bullishly above MACDAverage.
On 60-minute chart, SlowK is Bullishly above SlowD while MACD is Bearishly below MACDAverage.
Investment Disclaimer