Published
3 years ago on
January 25, 2021
Bitcoin (BTC/USD) extended recent gains early in today’s North American session as the pair strengthened to the 34888 area after trading as low as the 31605.31 area during the Asian session, a level reached after the pair traded as low as the 30931.21 level this weekend. That recent low was established after Stops were elected below the 31299.50 area, representing the 50% retracement of the recent appreciating range from 28732 to 33867. Chartists are noting that BTC/USD encountered some technical resistance around the 34810 area during the North American session, a previous relative high from early January. Chartists also note that BTC/USD’s intraday low around the 30931.21 level was a test of the 30885.50 area, representing the 23.6% retracement of the depreciating range from 37857 to 28732. Traders also note that Stops were recently elected above the 35943.73, 36480.83, and 36854.45 areas as well, upside price objectives related to previous buying pressure around the 17580, 16200, and 9819.83 levels and the sell-off intensified below these areas during the recent depreciation. During the recent move higher, Stops were recently elected above a series of additional upside price objectives, including the 40517.80, 40667.76, 40991.44, 41200, 41267.10, and 41489.74 levels. If BTC/USD is able to extend recent gains to the upside, additional upside price objectives include the 42309.01, 42701.91, 42803.53, 43447.48, and 43617.07 levels.
As expected, significant Stops were recently elected below the 33850.03 level, an area around the 38.2% retracement of the appreciating range from 27678 to 37823 and the 61.8% retracement of the appreciating range from 30100 to 40127.66. Large Stops were also recently triggered below the 32779.10 level, a downside retracement level related to the broader depreciating range from 41452.12 to 30100. Following this depreciation, additional areas of potential technical support include the 28148.19 and 27421.33 levels. Traders are observing that the 50-bar MA (4-hourly) is bearishly indicating below the 100-bar MA (4-hourly) and above the 200-bar MA (4-hourly). Also, the 50-bar MA (hourly) is bearishly indicating below the 200-bar MA (hourly) and above the 100-bar MA (hourly).
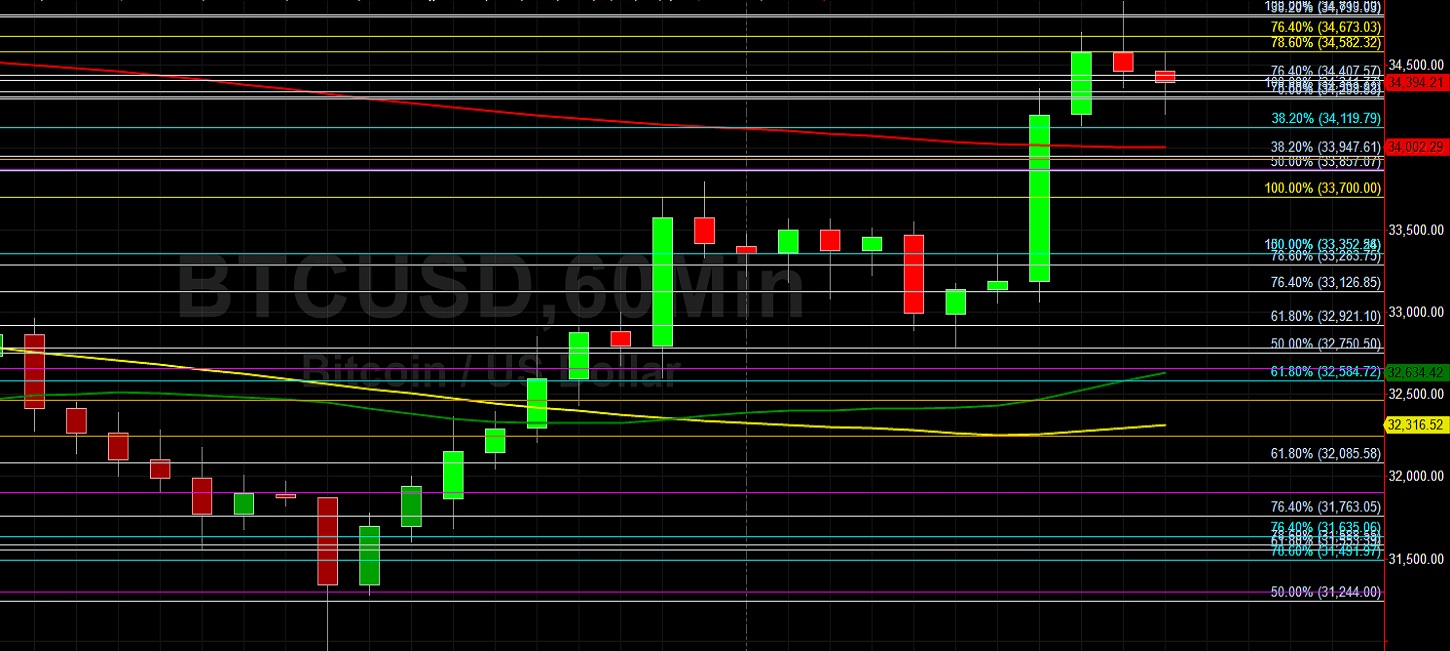
Price activity is nearest the 50-bar MA (4-hourly) at 33987.66 and the 200-bar MA (Hourly) at 34002.13.
Technical Support is expected around 29783.19/ 29093.19/ 28847.31 with Stops expected below.
Technical Resistance is expected around 42309.01/ 42701.91/ 42803.53 with Stops expected above.
On 4-Hourly chart, SlowK is Bullishly above SlowD while MACD is Bullishly above MACDAverage.
On 60-minute chart, SlowK is Bearishly below SlowD while MACD is Bullishly above MACDAverage.
Disclaimer: This trading analysis is provided by a third party, and for informational purposes only. It does not reflect the views of Crypto Daily, nor is it intended to be used as legal, tax, investment, or financial advice.
Investment DisclaimerFoundation: A New Trading Paradigm
Bitrue to List Hummingbot Governance Token (HBOT)