Published
3 years ago on
February 06, 2021
Ethereum
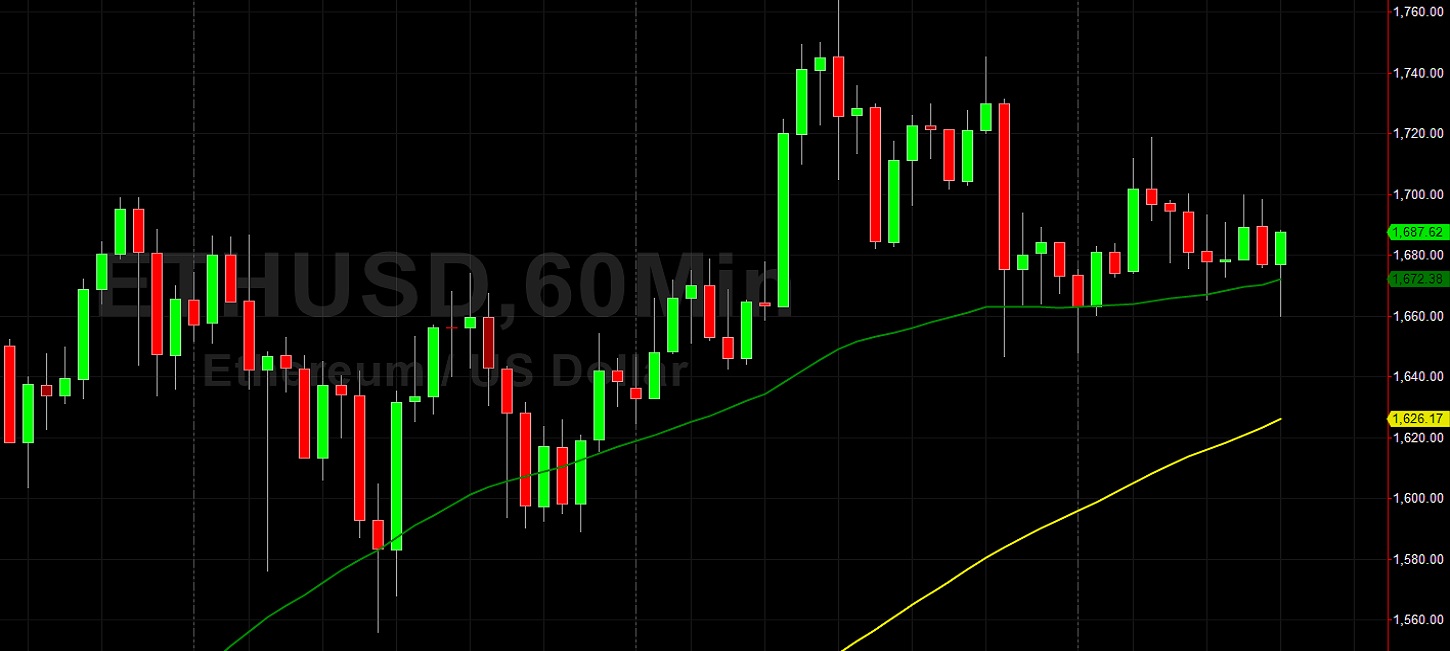
Ethereum (ETH/USD) was slightly weaker early in today’s North American session as the pair depreciated to the 1660area after trading as high as the 1745.25 area during the Asiansession. Chartists note the pair established a fresh multi-year high around the 1763.93 area late in the week, and that ETH/USD tested the 61.8% retracement of the recent depreciating range from 1763.93 to 1646.70 during the European session. Stops were recently elected above the 1711.20, 1716.45, 1733.12, and 1750.63 levels during the ascent, upside price objectives related to buying pressure that originated around the 148.08, 310.79, 439.77, and 123.72 areas. If ETH/USD is able to extend its upward momentum, additional upside price objectives include the 1805.21 and 1930.40 levels.
Following the recent climb of ETH/USD to multi-year highs, traders are carefully watching potential areas of technical support including the 1561.21, 1435.82, 1334.47, 1233.11, 1107.71, and 1088.81 levels. Some Stops were recently elected above the 1256.15, 1307.31, and 1315.02 areas, upside retracement levels related to the recent depreciating rangefrom 1390 to 1039.62. If ETH/USD reverses recent gains andthe psychologically-important 1000 figure cannot be held, technical traders will eye additional downside retracementareas including the 976.37, 954.16, 941.22, 917.03, 915.48, 902.24, and 895.33 levels. Traders are observing that the 50-bar MA (4-hourly) is bullishly indicating above the 100-bar MA (4-hourly) and above the 200-bar MA (4-hourly). Also, the 50-bar MA (hourly) is bullishly indicating above the 100-bar MA (hourly) and above the 200-bar MA (hourly).
Price activity is nearest the 50-bar MA (4-hourly) at 1494.97and the 50-bar MA (Hourly) at 1672.37.
Technical Support is expected around 1397.87/ 1329.47/ 1261.07 with Stops expected below.
Technical Resistance is expected around 1805.21/ 1930.40/ 1957.36 with Stops expected above.
On 4-Hourly chart, SlowK is Bearishly below SlowD while MACD is Bearishly below MACDAverage.
On 60-minute chart, SlowK is Bullishly above SlowD while MACD is Bearishly below MACDAverage.
Disclaimer: This trading analysis is provided by a third party, and for informational purposes only. It does not reflect the views of Crypto Daily, nor is it intended to be used as legal, tax, investment, or financial advice.
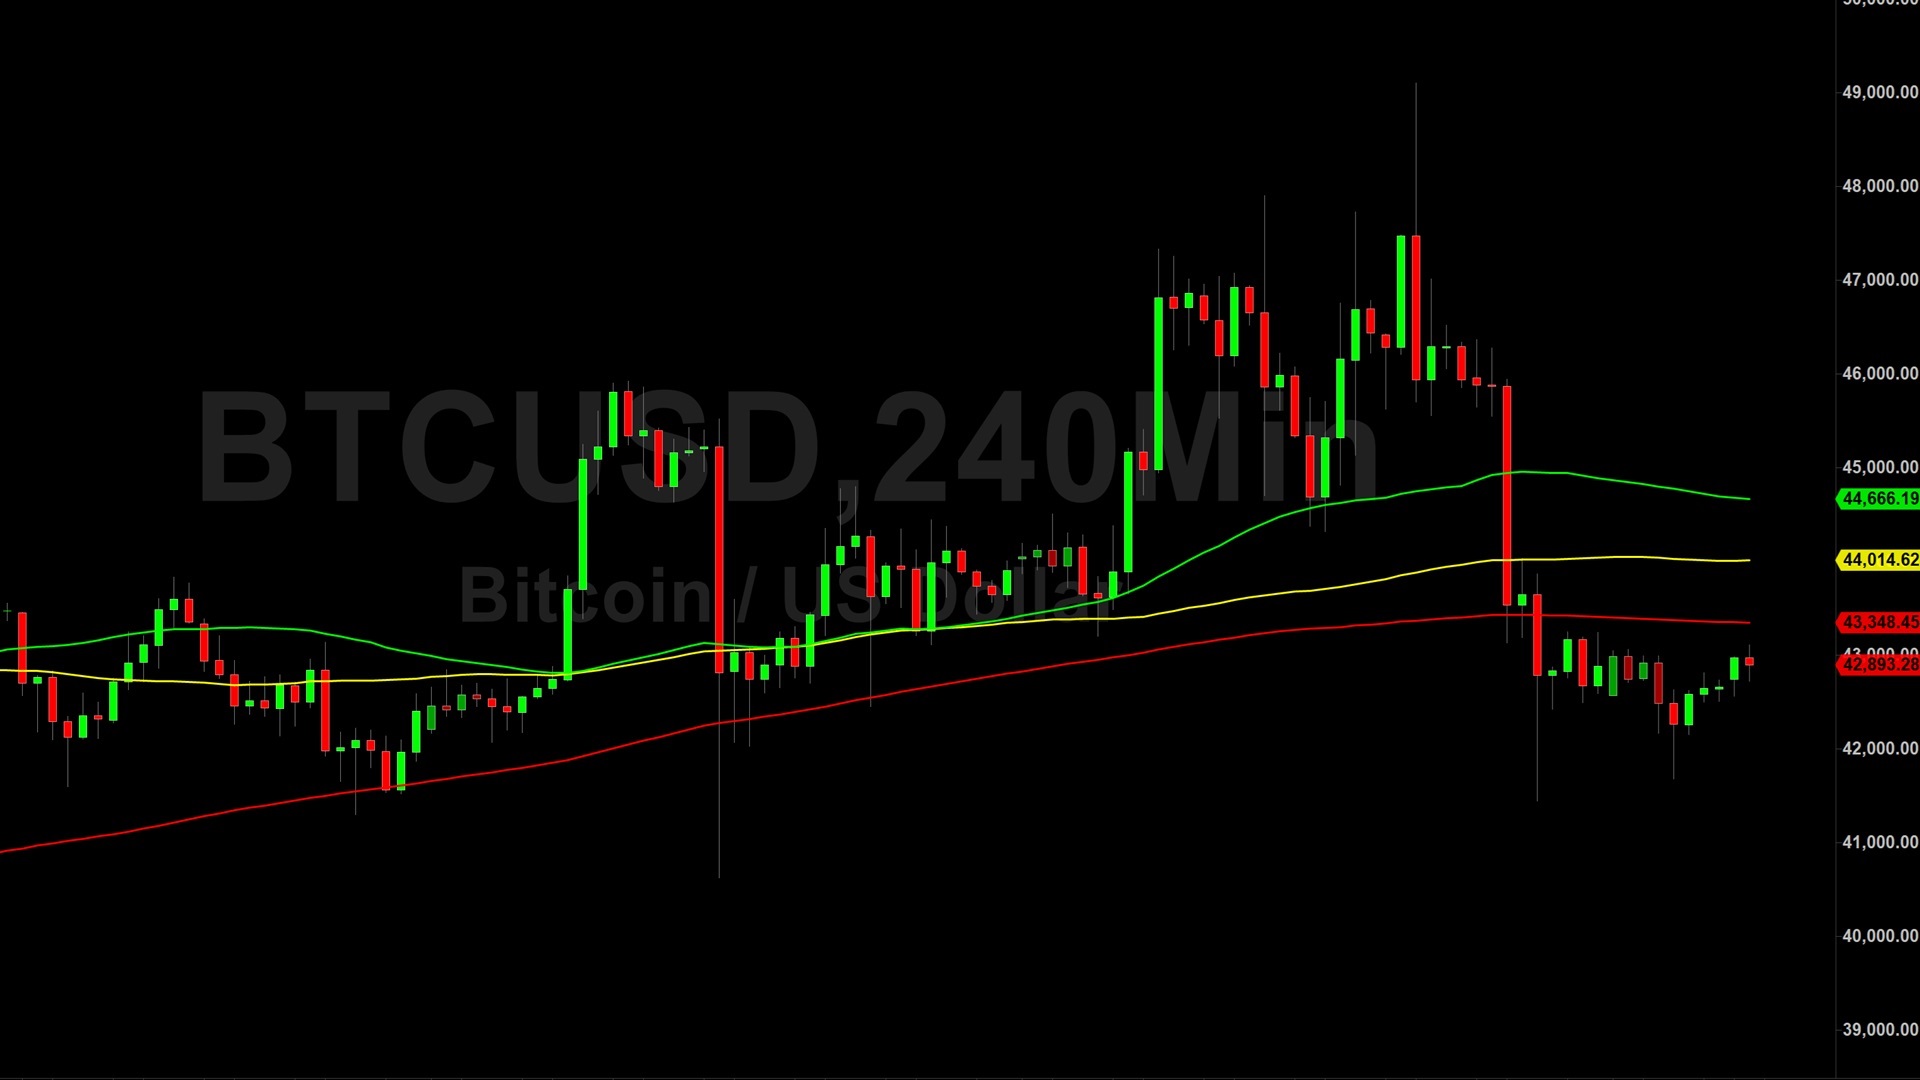
Investment DisclaimerBitcoin (BTC) Price Analysis: Bullish Test of 40256 Technical Support – 21 January 2024
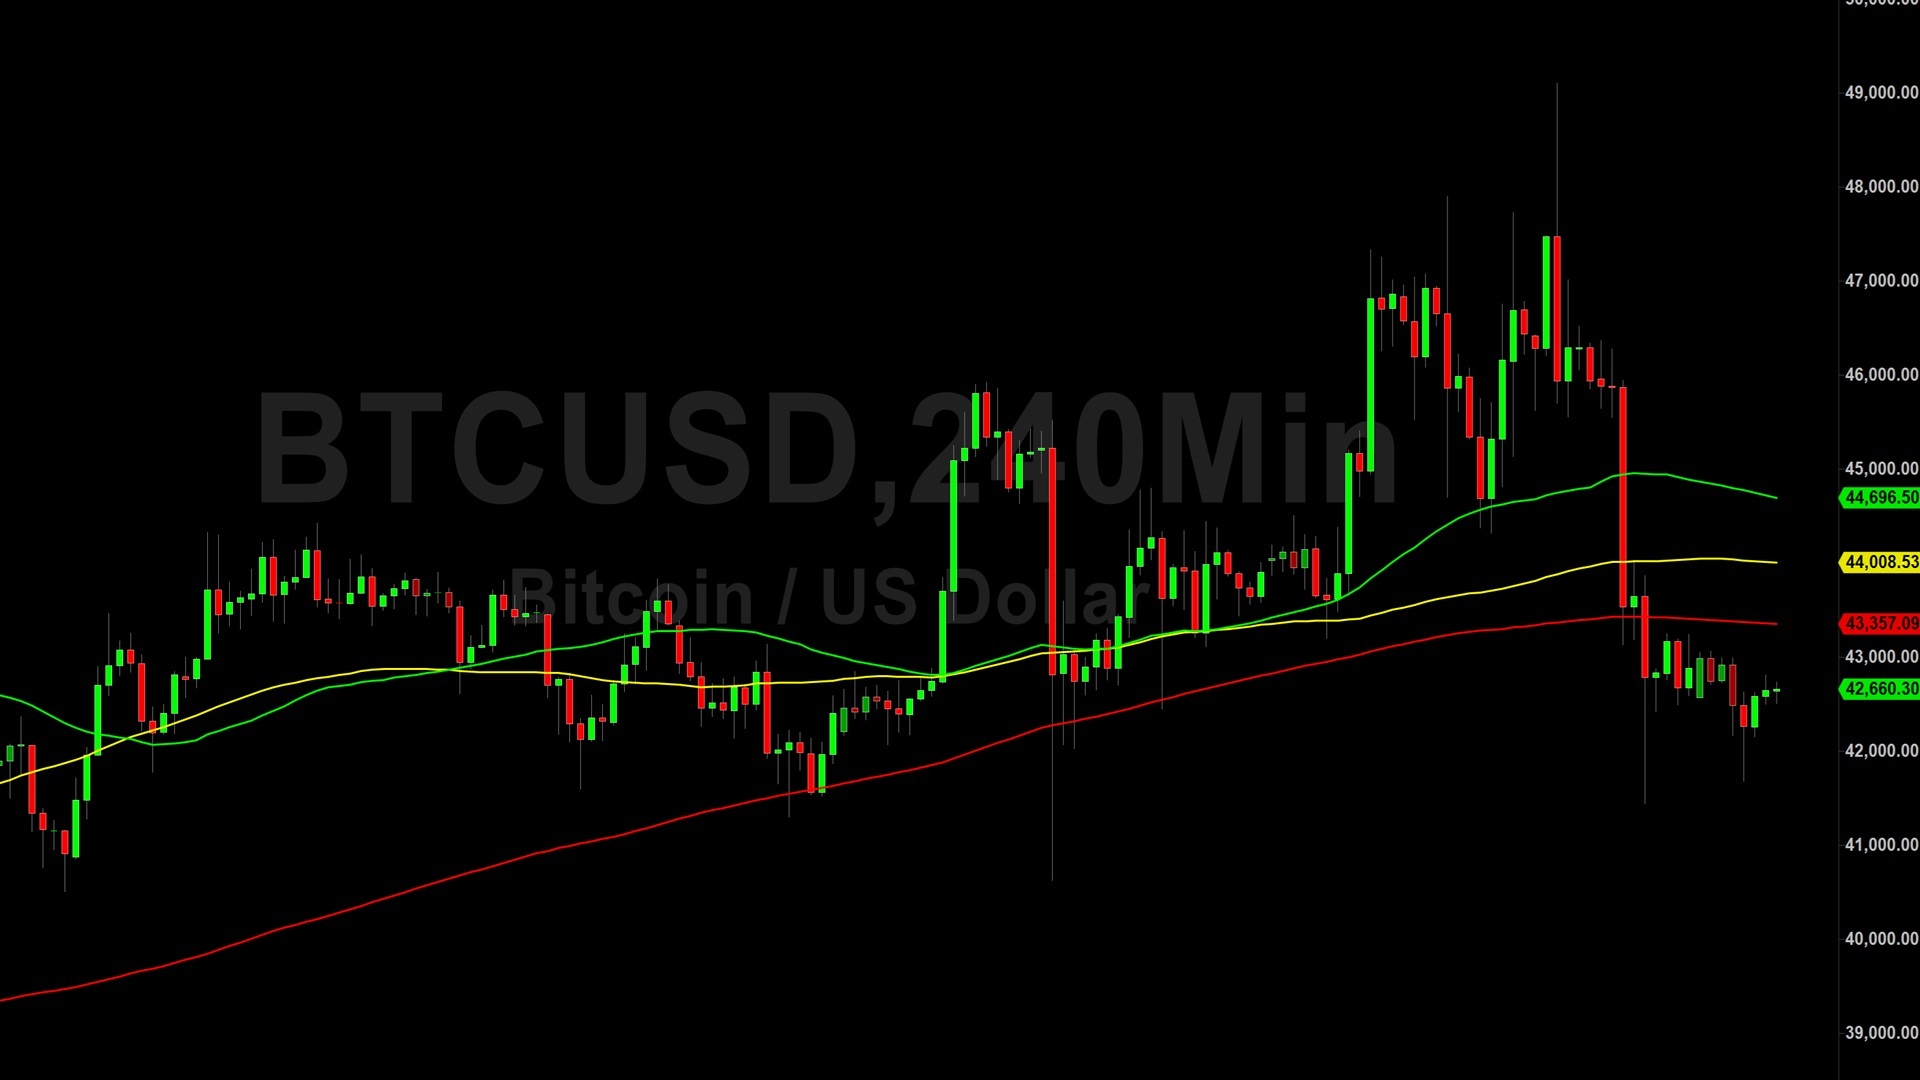
Bitcoin (BTC) Price Analysis: Bears Eyeing 39225 Price Objective – 20 January 2024