Published
3 years ago on
March 18, 2021
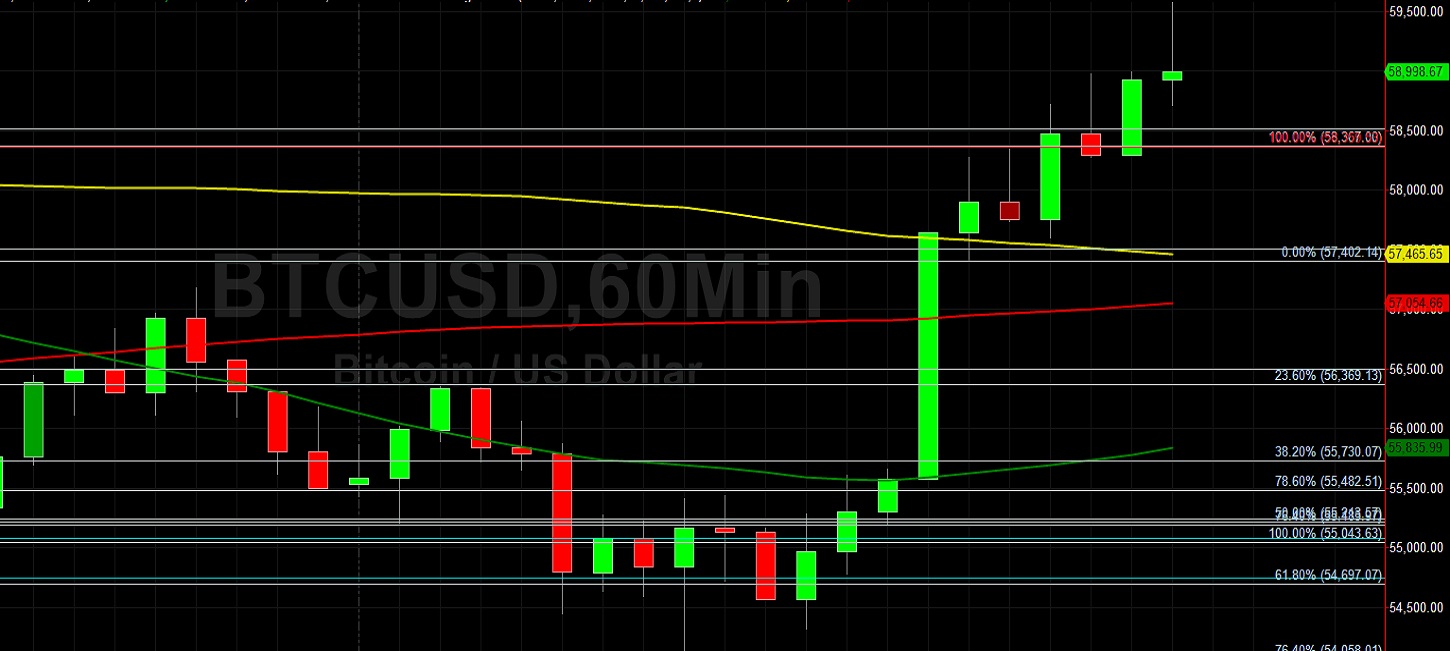
Bitcoin (BTC/USD) gained ground early in today’s Asian session as the pair appreciated to the 59576.18 area after trading as low as the 54138.01 area in the North American session, with the interday low just above the 76.4% retracement of the appreciating range from 53025 to 57402.14. Chartists observe that Stops were elected above the 57504.73 and 58515.68 retracement levels during BTC/USD’s climb, and tested the 76.4% retracement of the depreciating range from 61788.45 to 53221. Traders are paying close attention to see how BTC/USD trades around the psychologically-important 60000 figure. Stops were recently elected above some important upside price objectives including the 58896.80, 59792.54, 60069.04, 60368.14, 60522.13, and 61065.64 areas, targets related to buying pressure from the 16200, 17580, 21913.84, and 9819.83 levels.
If BTC/USD extends recent gains, additional upside price objectives include the 62026.52, 63788.17, 64436.39, and 64835.59 levels. Some areas of potential technical support during pullbacks include 53288.70, 52378.04, 52107.83, and 51997.03. Stronger technical support is likely in place around the 48030.38 and 46556.35 areas, with Stops likely in place below. Traders are observing that the 50-bar MA (4-hourly) is bullishly indicating above the 100-bar MA (4-hourly) and above the 200-bar MA (4-hourly). Also, the 50-bar MA (hourly) is bearishly indicating below the 100-bar MA (hourly) and below the 200-bar MA (hourly).
Price activity is nearest the 50-bar MA (4-hourly) at 57155.93 and the 100-bar MA (Hourly) at 57465.04.
Technical Support is expected around 53288.70/ 52378.04/ 52107.83 with Stops expected below.
Technical Resistance is expected around 62026.52/ 63788.17/ 64436.39 with Stops expected above.
On 4-Hourly chart, SlowK is Bullishly above SlowD while MACD is Bullishly above MACDAverage.
On 60-minute chart, SlowK is Bullishly above SlowD while MACD is Bullishly above MACDAverage.
Disclaimer: This trading analysis is provided by a third party, and for informational purposes only. It does not reflect the views of Crypto Daily, nor is it intended to be used as legal, tax, investment, or financial advice.
Investment DisclaimerDexalot Brings Its CEX-Like DEX Trading Platform To Ethereum L2 Arbitrum
Foundation: A New Trading Paradigm