Published
3 years ago on
March 14, 2021
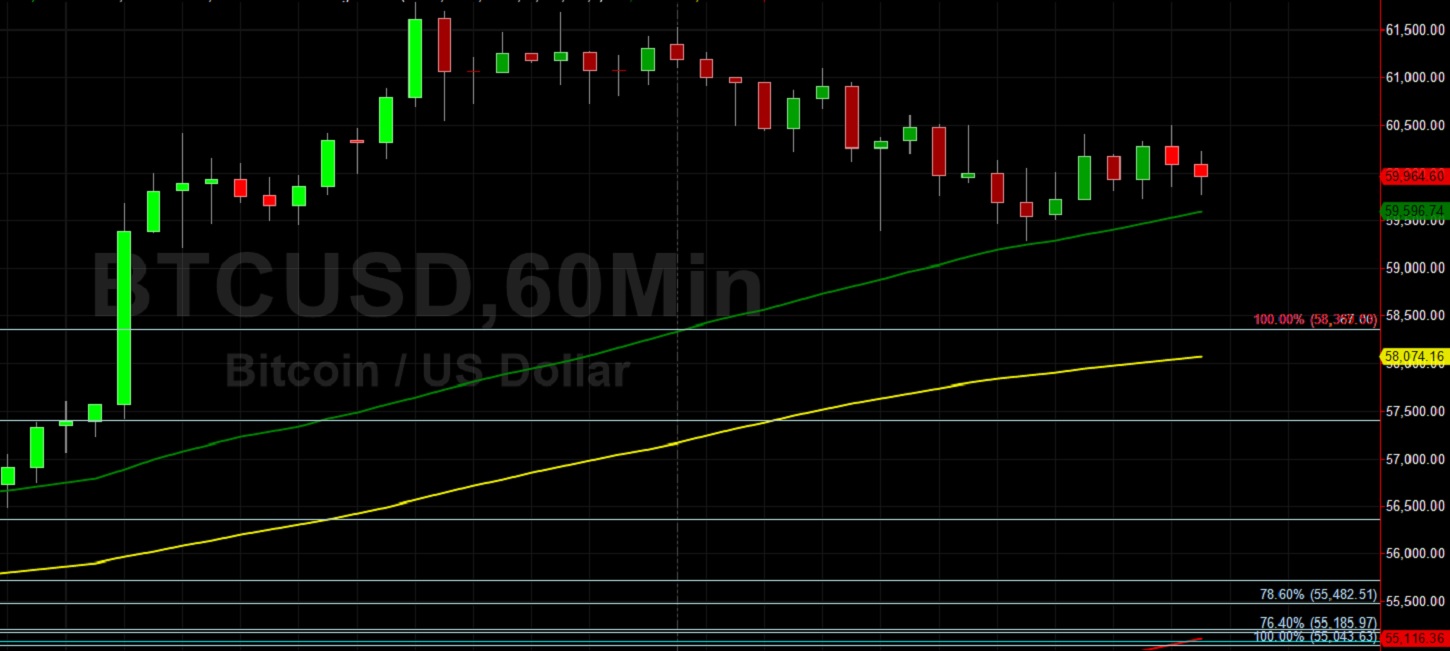
Bitcoin (BTC/USD) was slightly lower early in today’s Asian session as the pair depreciated to the 59767.25 area after trading as high as the 61524.03 area in the European session, with the interday high just below the all-time high of 61788.45 established this weekend. Buying pressure emerged around the 50-hour simple moving average during the North American session and Stops were elected below the 59720.28 area during the intraday pullback, representing the 23.6% retracement of the appreciating range from 53025 to 61788.45. Traders are paying close attention to see how BTC/USD trades around the psychologically-important 60000 figure. Stops were recently elected above some important upside price objectives including the 58896.80, 59792.54, 60069.04, 60368.14, 60522.13, and 61065.64 areas, targets related to buying pressure from the 16200, 17580, 21913.84, and 9819.83 levels.
If BTC/USD extends recent gains, additional upside price objectives include the 62026.52, 63788.17, 64436.39, and 64835.59 levels. Some areas of potential technical support during pullbacks include 55739.30, 54805.58, 54087.19, 53288.70, 52378.04, 52107.83, and 51997.03. Stronger technical support is likely in place around the 48030.38 and 46556.35 areas, with Stops likely in place below. Traders are observing that the 50-bar MA (4-hourly) is bullishly indicating above the 100-bar MA (4-hourly) and above the 200-bar MA (4-hourly). Also, the 50-bar MA (hourly) is bullishly indicating above the 100-bar MA (hourly) and above the 200-bar MA (hourly).
Price activity is nearest the 50-bar MA (4-hourly) at 55238.86 and the 50-bar MA (Hourly) at 59598.07.
Technical Support is expected around 55739.30/ 54805.58/ 54087.19 with Stops expected below.
Technical Resistance is expected around 62026.52/ 63788.17/ 64436.39 with Stops expected above.
On 4-Hourly chart, SlowK is Bearishly below SlowD while MACD is Bearishly below MACDAverage.
On 60-minute chart, SlowK is Bullishly above SlowD while MACD is Bearishly below MACDAverage.
Disclaimer: This trading analysis is provided by a third party, and for informational purposes only. It does not reflect the views of Crypto Daily, nor is it intended to be used as legal, tax, investment, or financial advice.
Investment DisclaimerFoundation: A New Trading Paradigm
Bitrue to List Hummingbot Governance Token (HBOT)