Published
3 years ago on
March 12, 2021
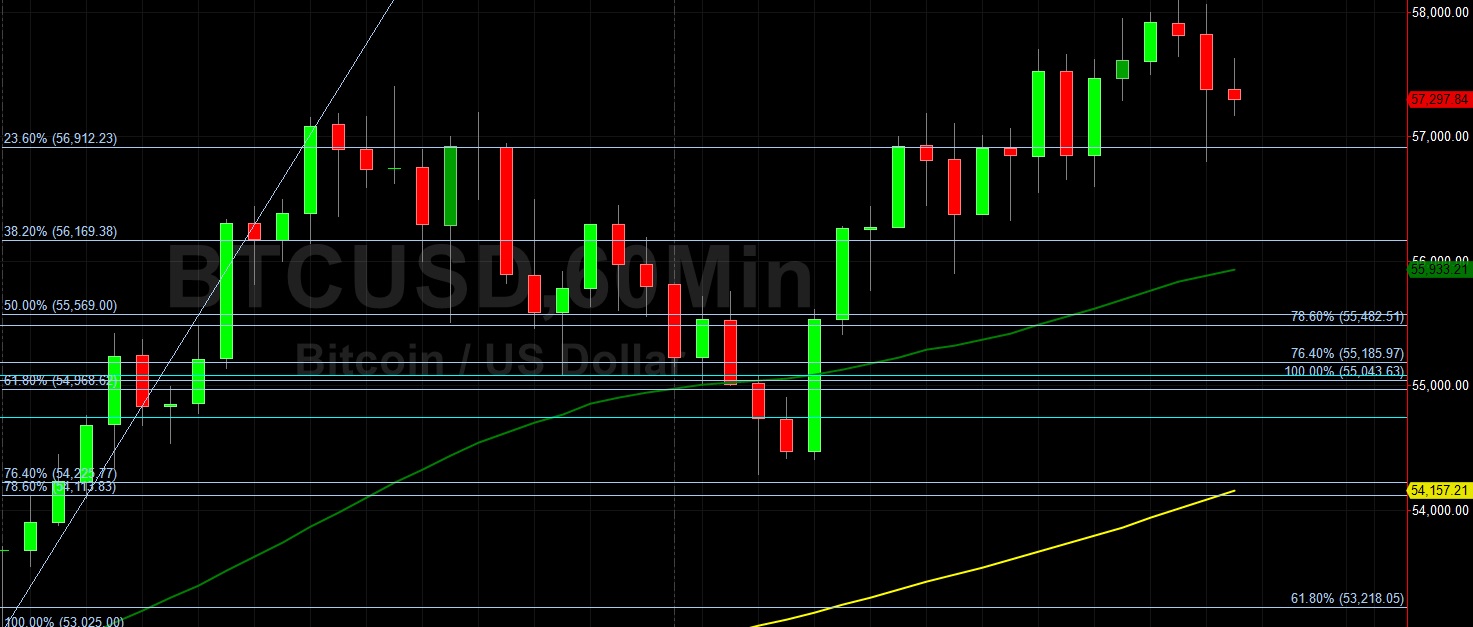
Bitcoin (BTC/USD) weakened early in today’s Asian session as the pair depreciated to the 56800 area after trading as high as the 58113 area earlier in the Asian session, just below the recent all-time high of 58367. Stops were elected above the 57402.14 area, a recent relative high from earlier this week, and buying pressure emerged around the 54283 during the European session. Stops were elected above the 55185.97 and 55482.51 levels during the recent climb to multi-day highs, representing the 76.4% and 78.6% retracements of the recent depreciating range. If BTC/USD continues its upward strength, traders will focus on upside price objectives including the 58896.80, 59724.81, 59792.54, 60,069.04, 60368.14, 60522.13, and 61064.65 levels.
Stops were recently elected above many significant technical levels during the latest move to a new all-time high, including the 51732.54, 52505.24, 53194.95, 53276.47, 54400, 55266.17, 55715.92, 56761.65, and 57427.73 levels. Some areas of potential technical support during pullbacks include 48661.95, 47841, 47740.74, 46702.30, 46219.32, 45293.40, and 45081.10. Stronger technical support is likely in place around the 43549.50, 42259.21, and 40052.57 areas, with Stops likely in place below. Traders are observing that the 50-bar MA (4-hourly) is bullishly indicating above the 100-bar MA (4-hourly) and above the 200-bar MA (4-hourly). Also, the 50-bar MA (hourly) is bullishly indicating above the 100-bar MA (hourly) and above the 200-bar MA (hourly).
Price activity is nearest the 50-bar MA (4-hourly) at 51675.10 and the 50-bar MA (Hourly) at 55932.70.
Technical Support is expected around 42786.36/ 41398.14/ 40314.60 with Stops expected below.
Technical Resistance is expected around 58896.80/ 59724.81/ 59792.54 with Stops expected above.
On 4-Hourly chart, SlowK is Bearishly below SlowD while MACD is Bullishly above MACDAverage.
On 60-minute chart, SlowK is Bearishly below SlowD while MACD is Bullishly above MACDAverage.
Disclaimer: This trading analysis is provided by a third party, and for informational purposes only. It does not reflect the views of Crypto Daily, nor is it intended to be used as legal, tax, investment, or financial advice.
Investment DisclaimerFoundation: A New Trading Paradigm
Bitrue to List Hummingbot Governance Token (HBOT)