Published
3 years ago on
March 08, 2021
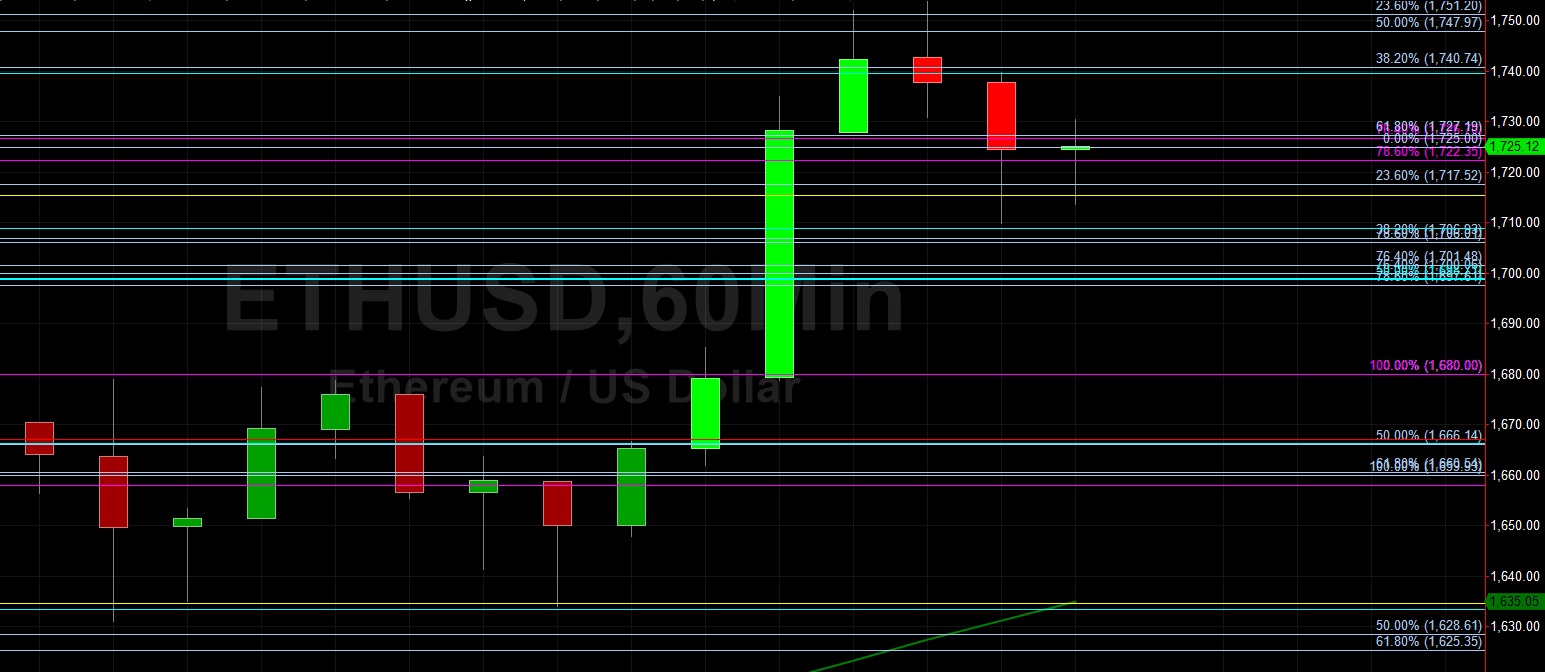
Ethereum (ETH/USD) came off early in today’s Asian session as the pair depreciated to the 1709.96 area after trading as high as the 1753.81 area earlier in the Asian session. Stops were elected above the 1751.20 area during the ascent, representing the 23.6% retracement of the depreciating range from 1836 to 1725. Traders observe ETH/USD continues to regain lost ground following its recent depreciation from its all-time high around the 2041.42 level to the 1292.76 area. The market has tested the 1667.09 level, representing the 50% retracement of this depreciating range, and additional upside retracement levels include 1755.43, 1864.74, and 1881.21. If ETH/USD extends its upward strength, additional upside price objectives include the 2080.48, 2134.98, 2150.66, and 2210.42 levels.
Stops were also recently elected above the 1930.40, 1957.36, and 2017.05 levels during the appreciation, areas related to historical buying pressure around the 215.16, 370.50, and 176.43 areas. Some areas of potential technical support during pullbacks include 1403.13, 1205.96, and 1008.79, with stronger technical support likely in place around 1296.30 and 1066.14. If ETH/USD extends its recent depreciation, potential technical support includes 1285.87 and 1205.96. Traders are observing that the 50-bar MA (4-hourly) is bearishly indicating below the 100-bar MA (4-hourly) and below the 200-bar MA (4-hourly). Also, the 50-bar MA (hourly) is bullishly indicating above the 100-bar MA (hourly) and above the 200-bar MA (hourly).
Price activity is nearest the 200-bar MA (4-hourly) at 1686.43 and the 50-bar MA (Hourly) at 1635.04.
Technical Support is expected around 1285.87/ 1205.96/ 1128.29 with Stops expected below.
Technical Resistance is expected around 2080.48/ 2134.98/ 2150.66 with Stops expected above.
On 4-Hourly chart, SlowK is Bullishly above SlowD while MACD is Bullishly above MACDAverage.
On 60-minute chart, SlowK is Bearishly below SlowD while MACD is Bullishly above MACDAverage.
Disclaimer: This trading analysis is provided by a third party, and for informational purposes only. It does not reflect the views of Crypto Daily, nor is it intended to be used as legal, tax, investment, or financial advice.
Investment DisclaimerFoundation: A New Trading Paradigm
Bitrue to List Hummingbot Governance Token (HBOT)