Published
3 years ago on
March 06, 2021
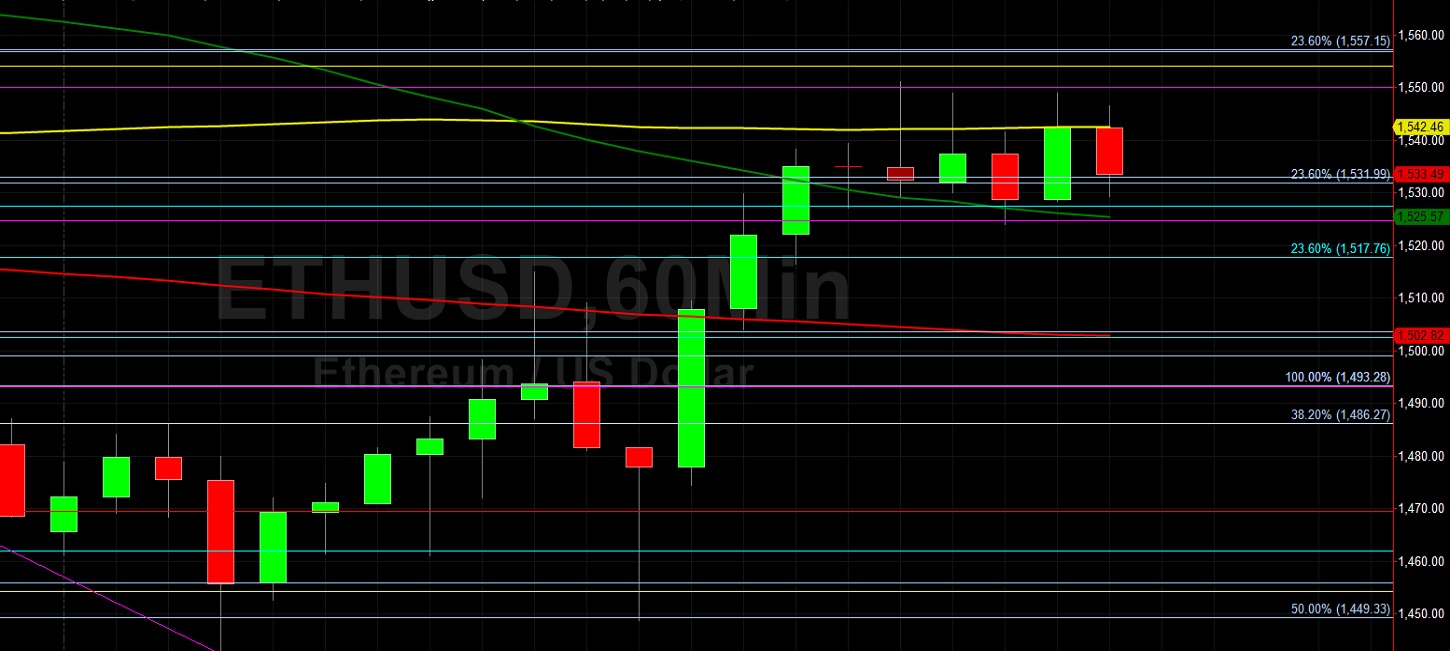
Ethereum (ETH/USD) was slightly weaker early in today’s Asian session as the pair depreciated to the 1529.36 area after trading as high as the 1551.19 area in the North American session, with the intraday high representing a test of the 50% retracement of the depreciating range from 1657.91 to 1442.32. Traders knocked ETH/USD as low as the 1442.32 area during the European session, representing a test of the 50% retracement from 1292.76 to 1605.89. Stops were recently elected below the 1533.04 and 1503.54 levels during the pullback lower, representing the 61.8% and 76.4% retracements of the appreciating range from 1455.86 to 1657.91. Additional Stops were recently elected above various retracement levels during the recent recovery higher, including the 1633.50 area that represents the 61.8% retracement of the depreciating range from 1805.03 to 1356. If ETH/USD extends its recent depreciation, potential technical support includes 1285.87 and 1205.96.
Stops were also recently elected above the 1930.40, 1957.36, and 2017.05 levels during the appreciation, areas related to historical buying pressure around the 215.16, 370.50, and 176.43 areas. Stops were also recently elected above upside price objectives including the 1711.20, 1716.45, 1733.12, 1750.63, and 1805.21 levels, upside price objectives were technically significant on account of buying pressure that originated around the 148.08, 310.79, 439.77, and 123.72 areas. If ETH/USD is able to extend its upward gains, additional upside price objectives include the 2080.48, 2134.98, 2150.66, and 2210.42 levels. Traders are observing that the 50-bar MA (4-hourly) is bearishly indicating below the 100-bar MA (4-hourly) and below the 200-bar MA (4-hourly). Also, the 50-bar MA (hourly) is bearishly indicating below the 100-bar MA (hourly) and above the 200-bar MA (hourly).
Price activity is nearest the 50-bar MA (4-hourly) at 1503.99 and the 100-bar MA (Hourly) at 1542.49.
Technical Support is expected around 1285.87/ 1205.96/ 1128.29 with Stops expected below.
Technical Resistance is expected around 2080.48/ 2134.98/ 2150.66 with Stops expected above.
On 4-Hourly chart, SlowK is Bullishly above SlowD while MACD is Bearishly below MACDAverage.
On 60-minute chart, SlowK is Bullishly above SlowD while MACD is Bullishly aboe MACDAverage.
Disclaimer: This trading analysis is provided by a third party, and for informational purposes only. It does not reflect the views of Crypto Daily, nor is it intended to be used as legal, tax, investment, or financial advice.
Investment DisclaimerDexalot Brings Its CEX-Like DEX Trading Platform To Ethereum L2 Arbitrum
Foundation: A New Trading Paradigm