Published
3 years ago on
April 11, 2021
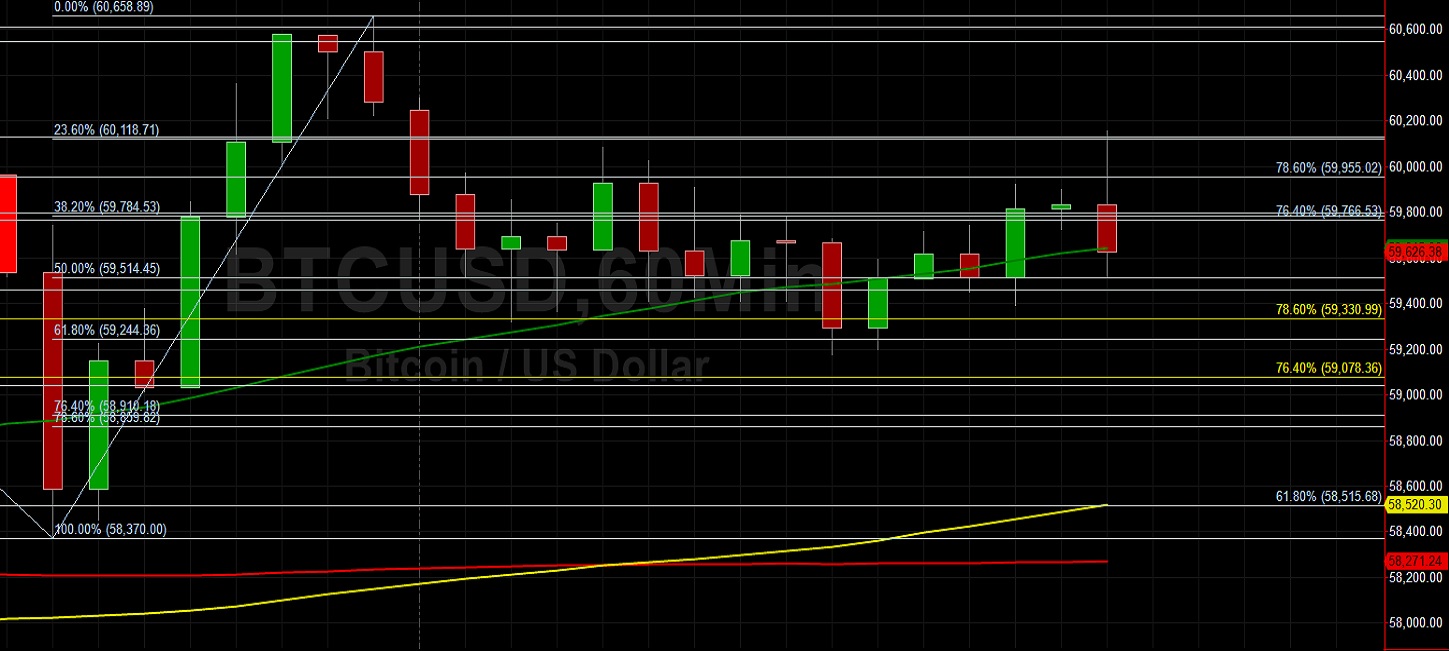
Bitcoin (BTC/USD) gained ground early in today’s Asian session as the pair appreciated to the 60157 level after trading as low as the 59117.06 level during the European session, with the interday low representing a test of the 76.4% retracement of the depreciating range from 61788.45 to 50305. Chartists note the intraday high represented a test of the 23.6% retracement of the appreciating range from 58370 to 60658.89, and was also around the 61.8% retracement of the depreciating range from 61218.87 to 58370. Recent buying pressure pushed BTC/USD above the 52166, 54003, 55841, 57353, and 58896 areas, upside price objectives related to buying pressure that emerged around the 46219.32, 17580, and 16200 areas. If BTC/USD extends recent gains, additional upside price objectives include the 62026.52, 63788.17, 64436.39, and 64835.59 levels.
Stops were recently elected below the 52402, 52166, 52107, 51997, and 50485 levels during the depreciation. Following the recent weakness, some downside levels of potential technical support include 50187, 49962, 49551, 49322, 48972, and 48634. Traders have lifted BTC/USD more than 90% year-to-date, pushing the pair as high as the 61788.45 level, a fresh all-time high. Traders are observing that the 50-bar MA (4-hourly) is bullishly indicating above the 100-bar MA (4-hourly) and above the 200-bar MA (4-hourly). Also, the 50-bar MA (hourly) is bullishly indicating above the 100-bar MA (hourly) and above the 200-bar MA (hourly).
Price activity is nearest the 50-bar MA (4-hourly) at 58258.20 and the 50-bar MA (Hourly) at 59646.52.
Technical Support is expected around 50187/ 49962/ 49551 with Stops expected below.
Technical Resistance is expected around 62026.52/ 63788.17/ 64436.39 with Stops expected above.
On 4-Hourly chart, SlowK is Bearishly below SlowD while MACD is Bullishly above MACDAverage.
On 60-minute chart, SlowK is Bullishly above SlowD while MACD is Bearishly below MACDAverage.
Disclaimer: This trading analysis is provided by a third party, and for informational purposes only. It does not reflect the views of Crypto Daily, nor is it intended to be used as legal, tax, investment, or financial advice.
Investment DisclaimerFoundation: A New Trading Paradigm
Bitrue to List Hummingbot Governance Token (HBOT)