Published
2 years ago on
April 26, 2021
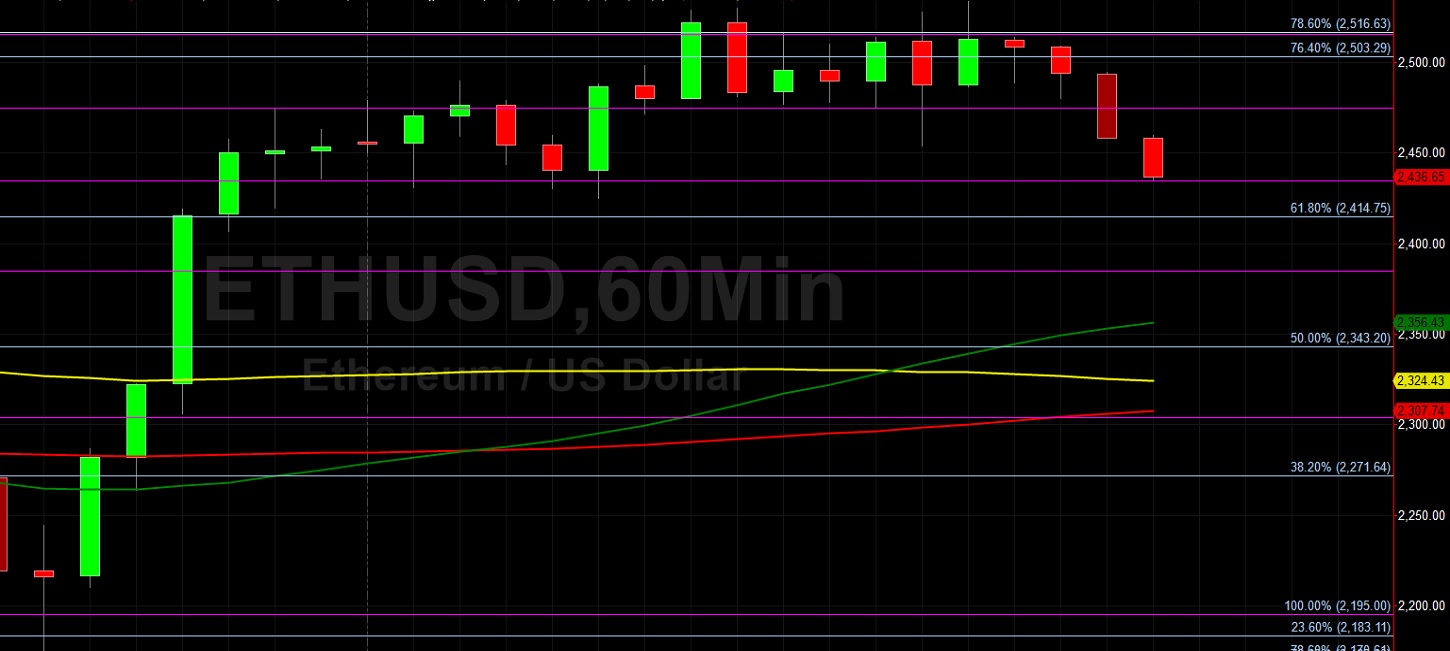
Ethereum (ETH/USD) weakened slightly in the Asian session as the pair depreciated to the 2462.32 level after trading as high as the 2533.79 area during the North American session, with the interday high representing a test of the 78.6% retracement of the depreciating range from 2646.39 to 2040. Traders pushed ETH/USD as low as the 2425 area during the European session before buying pressure lifted the pair to interday highs around the 23.6% retracement of the recent appreciating range from 2054.25 to 2646.20. Stops were recently elected above the 2585.62 level during the recent move to all-time highs, an upside price objective related to historic buying pressure around the 176.43 area. Stops were also elected above the 2417.77 and 2429.80 levels, representing the 76.4% and 78.6% retracements of the depreciating range from 2546.82 to 2000.
Significant Stops were also recently elected above many upside price objectives including 2150.66 and 2210.42, areas related to historical buying pressure around the 310.79 and 90 areas. Stops were recently elected below the 2311.47, 2251.76, 2165.15, 2068.50, and 2046.89 levels during the pullback. Additional upside price objectives include the 2677.40, 2756.26, and 2865.42 levels. Potential technical support levels during pullbacks include the 2506.50, 2420.08, and 2350.23 areas. Traders are observing that the 50-bar MA (4-hourly) is bullishly indicating above the 100-bar MA (4-hourly) and above the 200-bar MA (4-hourly). Also, the 50-bar MA (hourly) is bullishly indicating above the 100-bar MA (hourly) and above the 200-bar MA (hourly).
Price activity is nearest the 50-bar MA (4-hourly) at 2315.17 and the 50-bar MA (Hourly) at 2356.41.
Technical Support is expected around 1925.07/ 1780.10/ 1758.25 with Stops expected below.
Technical Resistance is expected around 2677.40/ 2756.26/ 2865.42 with Stops expected above.
On 4-Hourly chart, SlowK is Bearishly below SlowD while MACD is Bullishly above MACDAverage.
On 60-minute chart, SlowK is Bearishly below SlowD while MACD is Bearishly below MACDAverage.
Disclaimer: This trading analysis is provided by a third party, and for informational purposes only. It does not reflect the views of Crypto Daily, nor is it intended to be used as legal, tax, investment, or financial advice.
Investment DisclaimerDexalot Brings Its CEX-Like DEX Trading Platform To Ethereum L2 Arbitrum
Foundation: A New Trading Paradigm