Published
3 years ago on
April 05, 2021
Ethereum (ETH/USD) faded lower early in the Asian session as the pair weakened to the 2086.88 level after trading as high as the 2125 area during the North American session, with the interday high not far below the recent all-time high around the 2145 area. Traders took BTC/USD as low as the 2003.10 level during the European session, representing a test of the 38.2% retracement of the appreciating range from 1771.94 to 2145. Stops were elected above the 2081.97, 2106.06, and 2109.69 areas during the ascent, representing the 61.8%, 76.4%, and 78.6% retracements of the depreciating range from 2145 to 1990. Notably, the new all-time high of 2145 represented a test of the 2150.66 area, an upside price objective related to buying pressure around the 310.79 area. If ETH/USD extends its upward strength, additional upside price objectives include the 2210.42 and 2460.24 levels.
Below current market levels, some areas of potential technical support during pullbacks include 1932.59, 1906.64, 1859.89, 1822.11, 1764.32, 1737.57, and 1730.52. Beyond those levels, additional areas of technical support include 1403.13, 1296.30, and 1205.96. Stops were also recently elected above the 1930.40, 1957.36, and 2017.05 levels during the appreciation, areas related to historical buying pressure around the 215.16, 370.50, and 176.43 areas. Traders are observing that the 50-bar MA (4-hourly) is bullishly indicating above the 100-bar MA (4-hourly) and above the 200-bar MA (4-hourly). Also, the 50-bar MA (hourly) is bullishly indicating above the 200-bar MA (hourly) and above the 200-bar MA (hourly).
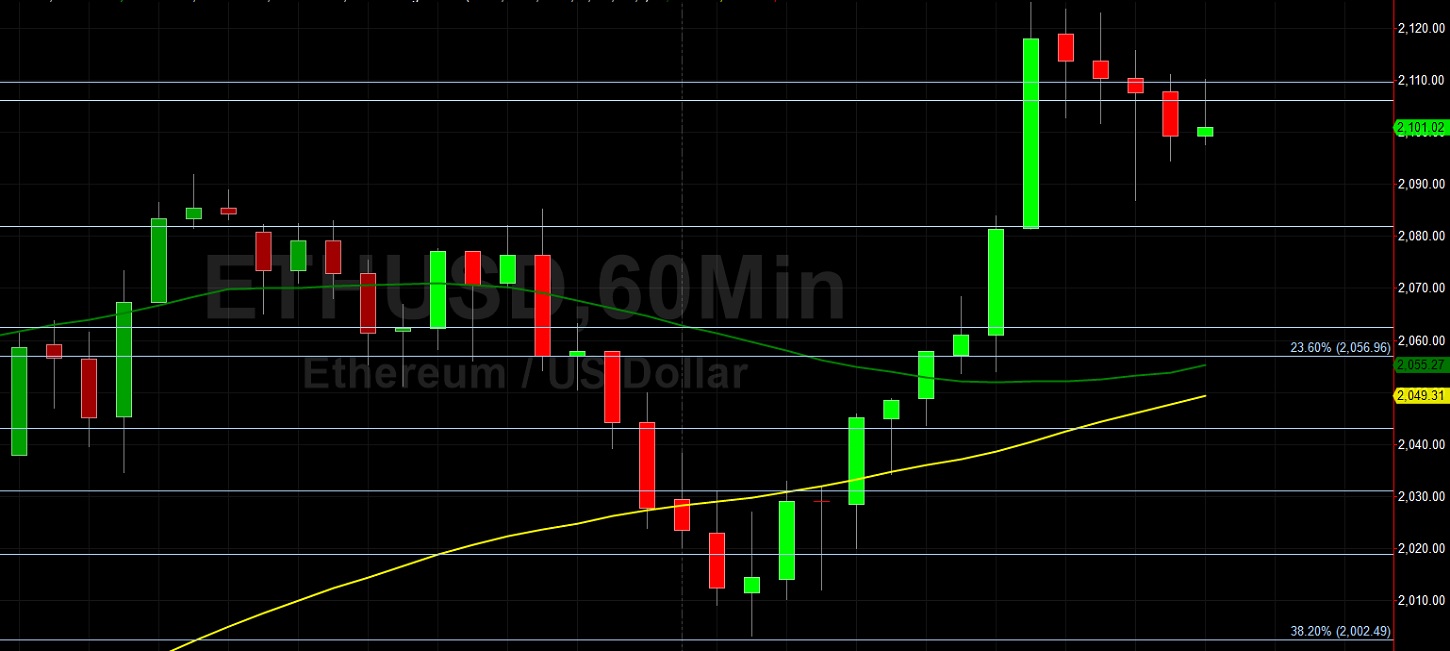
Price activity is nearest the 50-bar MA (4-hourly) at 1936.17 and the 50-bar MA (Hourly) at 2055.30.
Technical Support is expected around 1285.87/ 1205.96/ 1128.29 with Stops expected below.
Technical Resistance is expected around 2150.66/ 2210.42/ 2460.24 with Stops expected above.
On 4-Hourly chart, SlowK is Bullishly above SlowD while MACD is Bearishly below MACDAverage.
On 60-minute chart, SlowK is Bearishly below SlowD while MACD is Bullishly above MACDAverage.
Disclaimer: This trading analysis is provided by a third party, and for informational purposes only. It does not reflect the views of Crypto Daily, nor is it intended to be used as legal, tax, investment, or financial advice.
Investment DisclaimerDexalot Brings Its CEX-Like DEX Trading Platform To Ethereum L2 Arbitrum
Foundation: A New Trading Paradigm