Published
2 years ago on
May 24, 2021
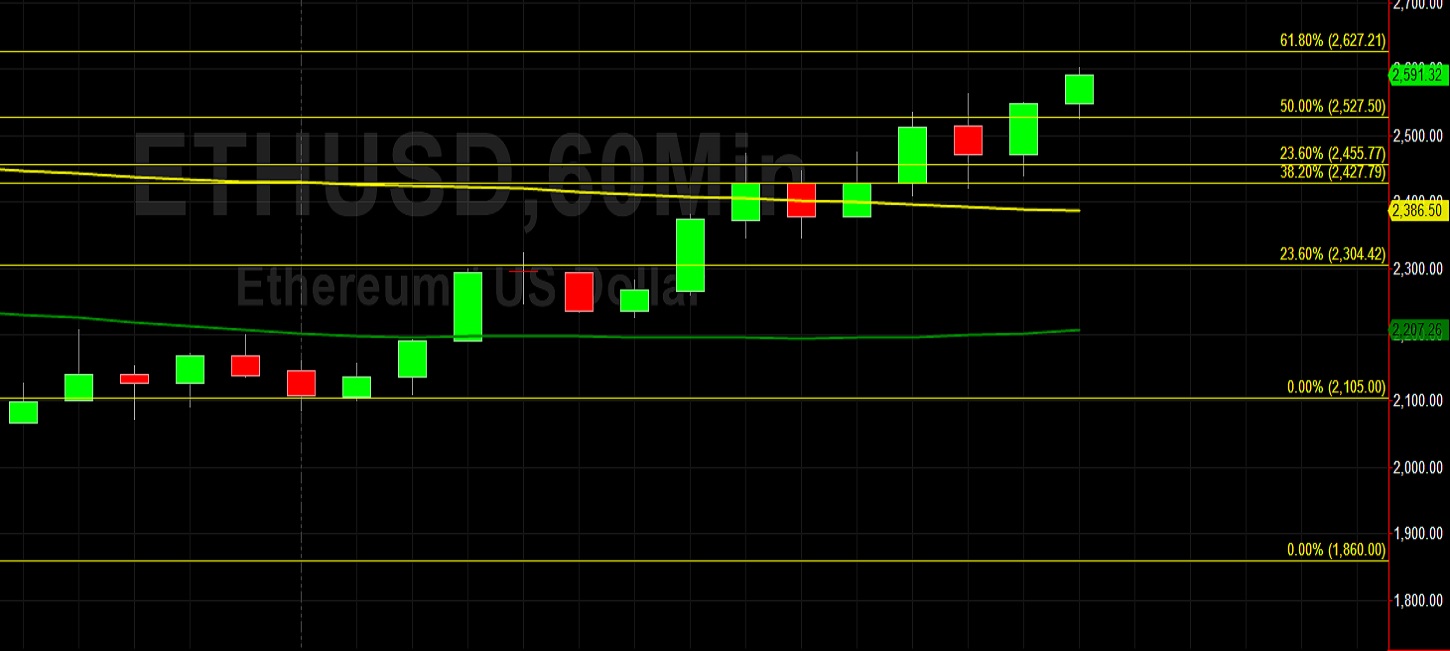
Ethereum (ETH/USD) added to recent gains early in the Asian session as the pair appreciated to the 2563.08 level after trading as low as the 2099.94 area during the European session, with the interday high representing a test of the 50% retracement of the recent depreciating range from 2950 to 2105. Traders observe the interday low was right around the 2105 area, a previous relative low following the recent pullback to the 1860 area. Selling pressure intensified from the 3567.40 area in recent trading sessions and Stops were elected below several downside price objectives and areas of potential technical support, including the 3485.38, 3212.13, 2938.87, 2725.38, 2600.77, 2549.82, 2451.84, 2334.65, 2178.29, 2054.25, 1987.71, 1944, 1912.06, and 1874.99 levels.
Potential technical support levels during pullbacks include the 1783.89, 1755.41, 1730.47, 1456.03, 1371.71, 1317.79, 1229.48, and 1103.49 levels. During the recent appreciation to an all-time high around the 4384.43 area, Stops were elected above the 3987.65, 4113.81, and 4136.61 areas, upside price objectives related to historic buying pressure that originated around the 90 figure. Additional upside project objectives include the 4453.47, 4471.68, 4522.73, 4550.12, and 4609.38 levels. Traders are observing that the 50-bar MA (4-hourly) is bearishly indicating below the 100-bar MA (4-hourly) and below the 200-bar MA (4-hourly). Also, the 50-bar MA (hourly) is bearishly indicating below the 100-bar MA (hourly) and below the 200-bar MA (hourly).
Price activity is nearest the 50-bar MA (4-hourly) at 2764.55 and the 100-bar MA (Hourly) at 2388.68.
Technical Support is expected around 1860/ 1783.89/ 1755.41 with Stops expected below.
Technical Resistance is expected around 3122.22/ 3420.10/ 3788.66 with Stops expected above.
On 4-Hourly chart, SlowK is Bullishly above SlowD while MACD is Bullishly above MACDAverage.
On 60-minute chart, SlowK is Bearishly below SlowD while MACD is Bullishly above MACDAverage.
Disclaimer: This trading analysis is provided by a third party, and for informational purposes only. It does not reflect the views of Crypto Daily, nor is it intended to be used as legal, tax, investment, or financial advice.
Investment DisclaimerFoundation: A New Trading Paradigm
Bitrue to List Hummingbot Governance Token (HBOT)