Published
2 years ago on
June 01, 2021
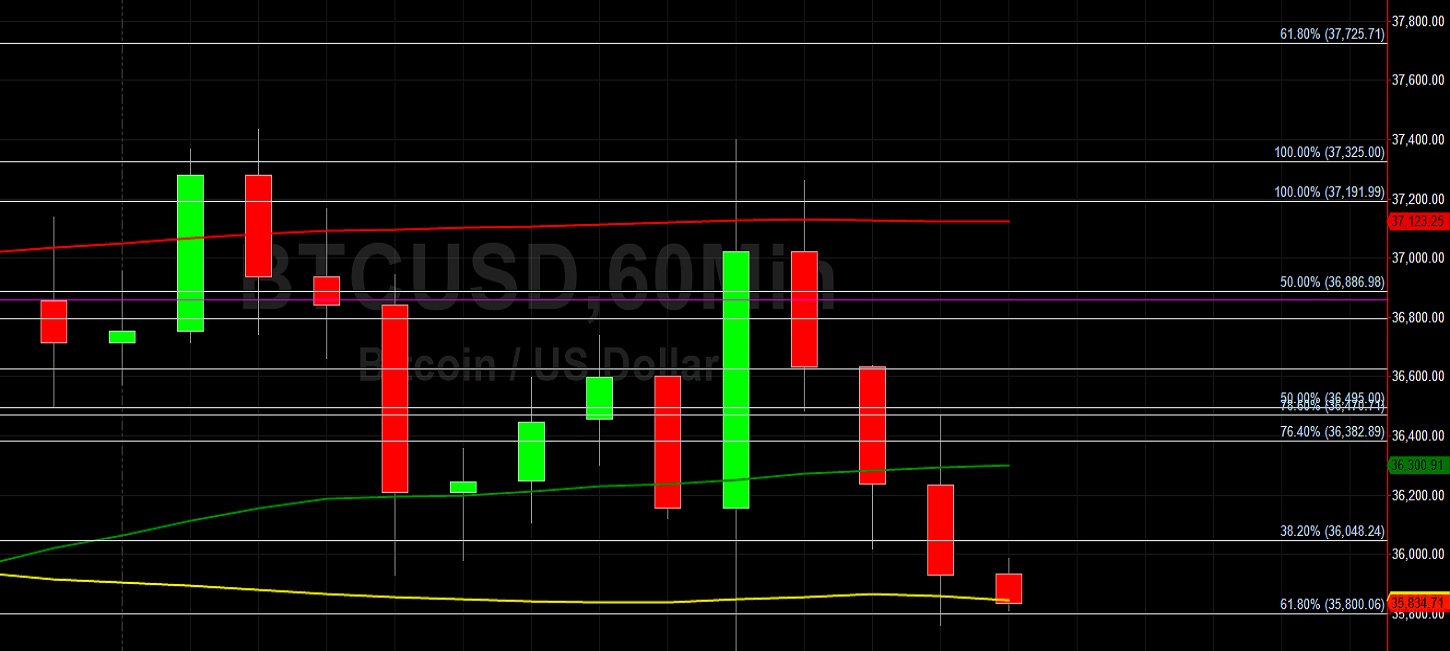
Bitcoin (BTC/USD) weakened early in today’s Asian session as the pair depreciated to the 35761.77 level after trading as high as the 37434.89 level during the European session, with the interday low representing a test of the 61.8% retracement of the depreciating range from 37325 to 33333. Traders had pushed BTC/USD higher to the 37434.89 area during the European session, testing recent technical resistance around the 37325 area, before moving it lower to the 35669.14 area. Stops were recently elected below some key downside price objectives including the 40418.15 and 32856 areas, levels related to selling pressure that emerged around the 64899 area. Additional Stops were elected below the 31112.66 area during the recent crash to 30000, representing the 78.6% retracement of the appreciating range from 21913.84 to 64899.
Many technical support levels related to broader historic ranges also gave way during the recent acute move lower including the 51375, 51245, 50527, 48478, 47698, 47136, 41581, 40303, and 39604 areas. Upside retracement levels and areas of potential technical resistance include 44796.10, 48287.98, 52608.44, and 53259.47. The recent lifetime high of 64899 represented a test of the 64835.59 area, an upside price objective that is technically significant based on buying pressure that emerged around the 16200 area. Potential areas of technical support include the 29156, 28747.28, 28387, 27706.27, 27317.26, 27175.66, 26621.59, and 26249 levels. Traders are observing that the 50-bar MA (4-hourly) is bearishly indicating below the 200-bar MA (4-hourly) and below the 100-bar MA (4-hourly). Also, the 50-bar MA (hourly) is bearishly indicating below the 200-bar MA (hourly) and above the 100-bar MA (hourly).
Price activity is nearest the 50-bar MA (4-hourly) at 37227.21 and the 200-bar MA (Hourly) at 37132.99.
Technical Support is expected around 29156/ 28747.28/ 27706.27 with Stops expected below.
Technical Resistance is expected around 46000/ 51569.56/ 64899 with Stops expected above.
On 4-Hourly chart, SlowK is Bearishly below SlowD while MACD is Bullishly above MACDAverage.
On 60-minute chart, SlowK is Bullishly above SlowD while MACD is Bearishly below MACDAverage.
Disclaimer: This trading analysis is provided by a third party, and for informational purposes only. It does not reflect the views of Crypto Daily, nor is it intended to be used as legal, tax, investment, or financial advice.
Investment DisclaimerFoundation: A New Trading Paradigm
Bitrue to List Hummingbot Governance Token (HBOT)