Published
2 years ago on
July 12, 2021
Bitcoin (BTC/USD) backed away from some recent gains early in the Asian session as the pair continued to be offered below the 35679.05 level, a downside price objective related to selling pressure that emerged around the 59592.20 level. Traders lifted BTC/USD to the 34670 area after Stops were elected above the 34484.12 area, representing the 61.8% retracement of the recent depreciating range from 35951 to 32111. Buying pressure recently emerged around the 33027.83 area, representing a test of the 23.6% retracement of the same depreciating range. Traders observe BTC/USD continues to be offered below the 38236.16 area, a level that represents the 23.6% retracement of the depreciating range from the lifetime high of 64899 to 30000.
Also, the 36983.76 level represents the 23.6% retracement of the depreciating range from 59592.20 to 30000, and traders are closely watching to see if this level can be absorbed during moves higher. Stops were recently elected below a series of downside price objectives, including the 31676.16, 30950.63, and 30029.66 areas. Traders anticipate large Stops below the 28747.28 level, and their election could open a test of major technical support around the 27706, 27317, 27175, 26593, and 26235 areas. Traders are observing that the 50-bar MA (4-hourly) is bearishly indicating below the 100-bar MA (4-hourly) and below the 200-bar MA (4-hourly). Also, the 50-bar MA (hourly) is bearishly indicating below the 200-bar MA (hourly) and above the 100-bar MA (hourly).
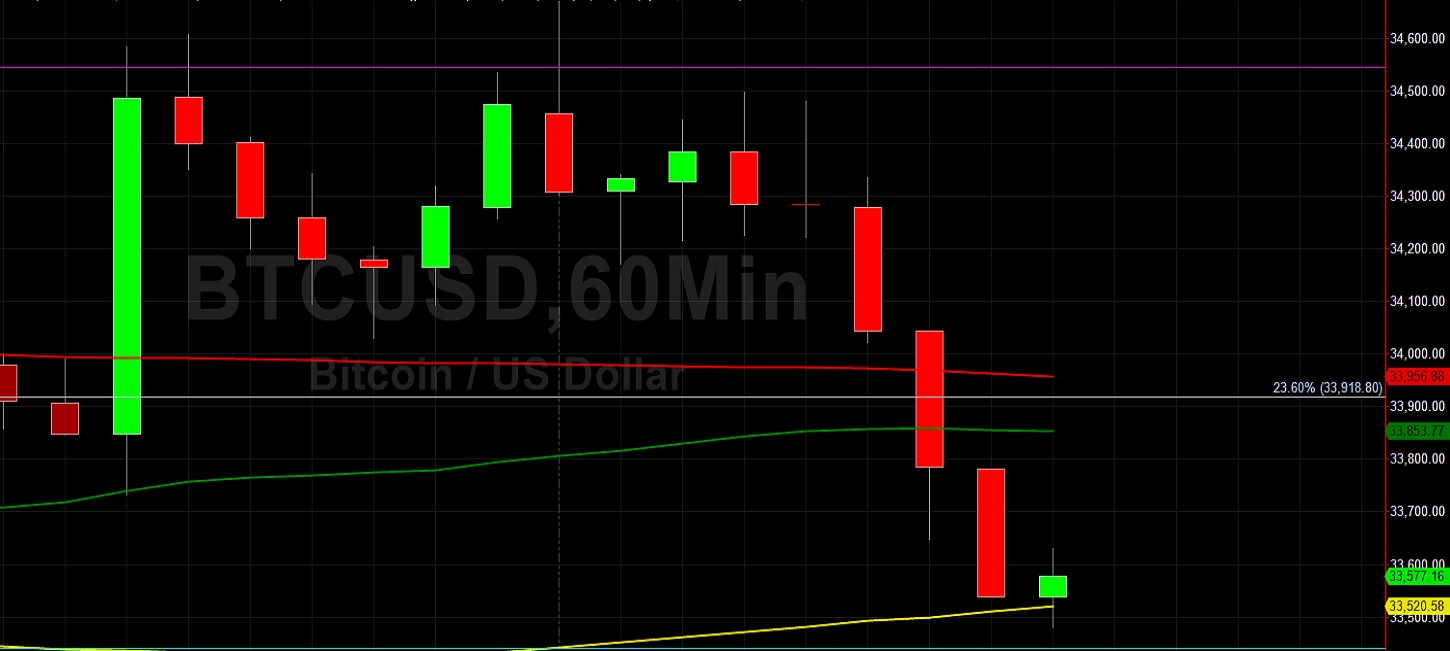
Price activity is nearest the 50-bar MA (4-hourly) at 33909.47 and the 100-bar MA (Hourly) at 33520.63.
Technical Support is expected around 28747.28/ 27706.27/ 27175.66 with Stops expected below.
Technical Resistance is expected around 46000/ 51569.56/ 64899 with Stops expected above.
On 4-Hourly chart, SlowK is Bearishly below SlowD while MACD is Bullishly above MACDAverage.
On 60-minute chart, SlowK is Bearishly below SlowD while MACD is Bearishly below MACDAverage.
Disclaimer: This trading analysis is provided by a third party, and for informational purposes only. It does not reflect the views of Crypto Daily, nor is it intended to be used as legal, tax, investment, or financial advice.
Investment DisclaimerFoundation: A New Trading Paradigm
Bitrue to List Hummingbot Governance Token (HBOT)