Bitcoin (BTC/USD) extended its recent pullback early in the Asian session as the pair continued to consolidate after recently establishing a new lifetime high around the 66999 level, a move that represented a test of an upside price objective around the 67146.16 area. Selling pressure increased around the 66650 area and intensified around the 63750 level, pushing BTC/USD lower to test a downside price objective around the 59867 area. Stops were elected below the 61959, 61469, and 60851 areas during the pullback, and additional downside price objectives include the 59060, 58265, 56284, and 53081 areas. Stops were recently elected above key upside price objectives during the move higher, including the 65719.69 and 66380.94 levels, price areas related to buying pressure that emerged around the 53873 and 66380 levels.
As traders continue to accumulate long positions, there is renewed focus on upside retracement levels and areas of potential technical resistance including the 67146, 68515, 69449, 71974, and 73245 areas. Following the pair’s recent gains, downside retracement levels and areas of potential technical support include the 63784, 61796, 60189, 58581, 56593, 57627, and 56293 levels. Traders are observing that the 50-bar MA (4-hourly) is bullishly indicating above the 100-bar MA (4-hourly) and above the 200-bar MA (4-hourly). Also, the 50-bar MA (hourly) is bullishly indicating above the 100-bar MA (hourly) and above the 200-bar MA (hourly).
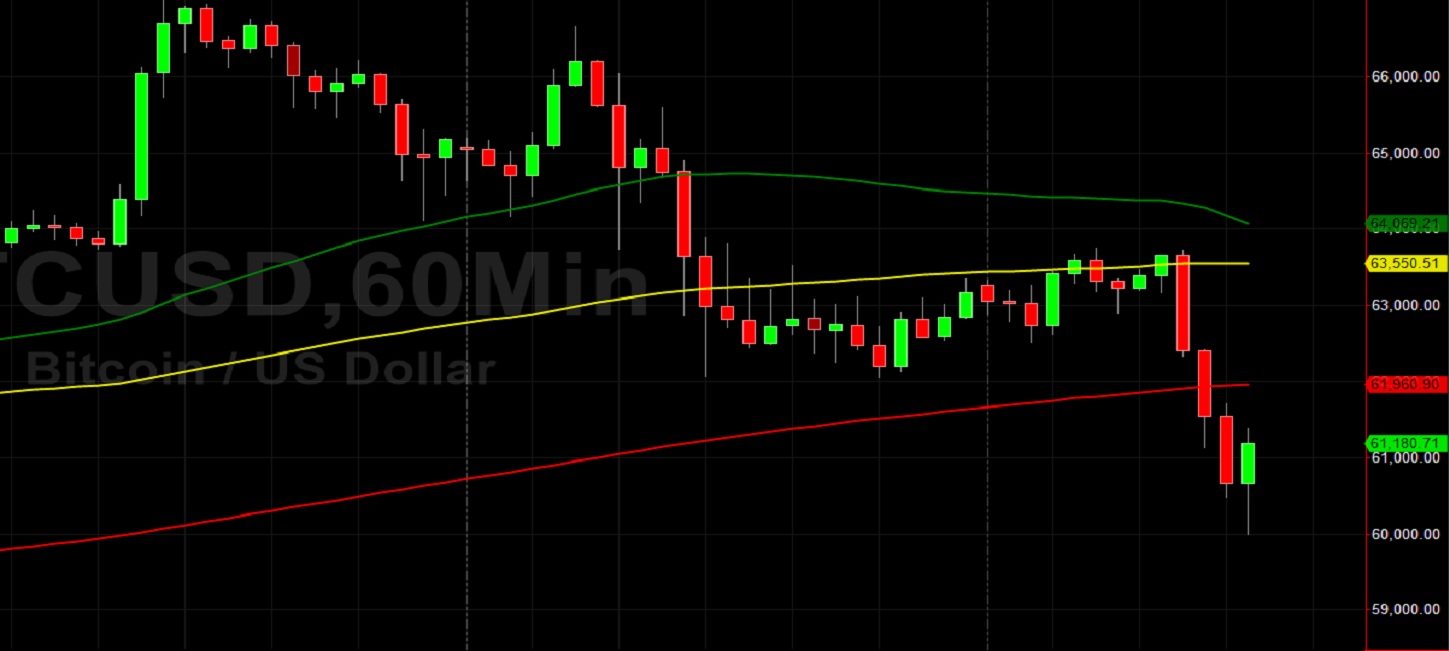
Price activity is nearest the 50-bar MA (4-hourly) at 62020.95 and the 50-bar MA (Hourly) at 61960.61.
Technical Support is expected around 53997.15/ 51245.86/ 49022.22 with Stops expected below.
Technical Resistance is expected around 67146.16/ 68515.32/ 69449.40 with Stops expected above.
On 4-Hourly chart, SlowK is Bearishly below SlowD while MACD is Bearishly below MACDAverage.
On 60-minute chart, SlowK is Bearishly below SlowD while MACD is Bearishly below MACDAverage.
Disclaimer: This trading analysis is provided by a third party, and for informational purposes only. It does not reflect the views of Crypto Daily, nor is it intended to be used as legal, tax, investment, or financial advice.