Published
11 months ago on
May 04, 2023
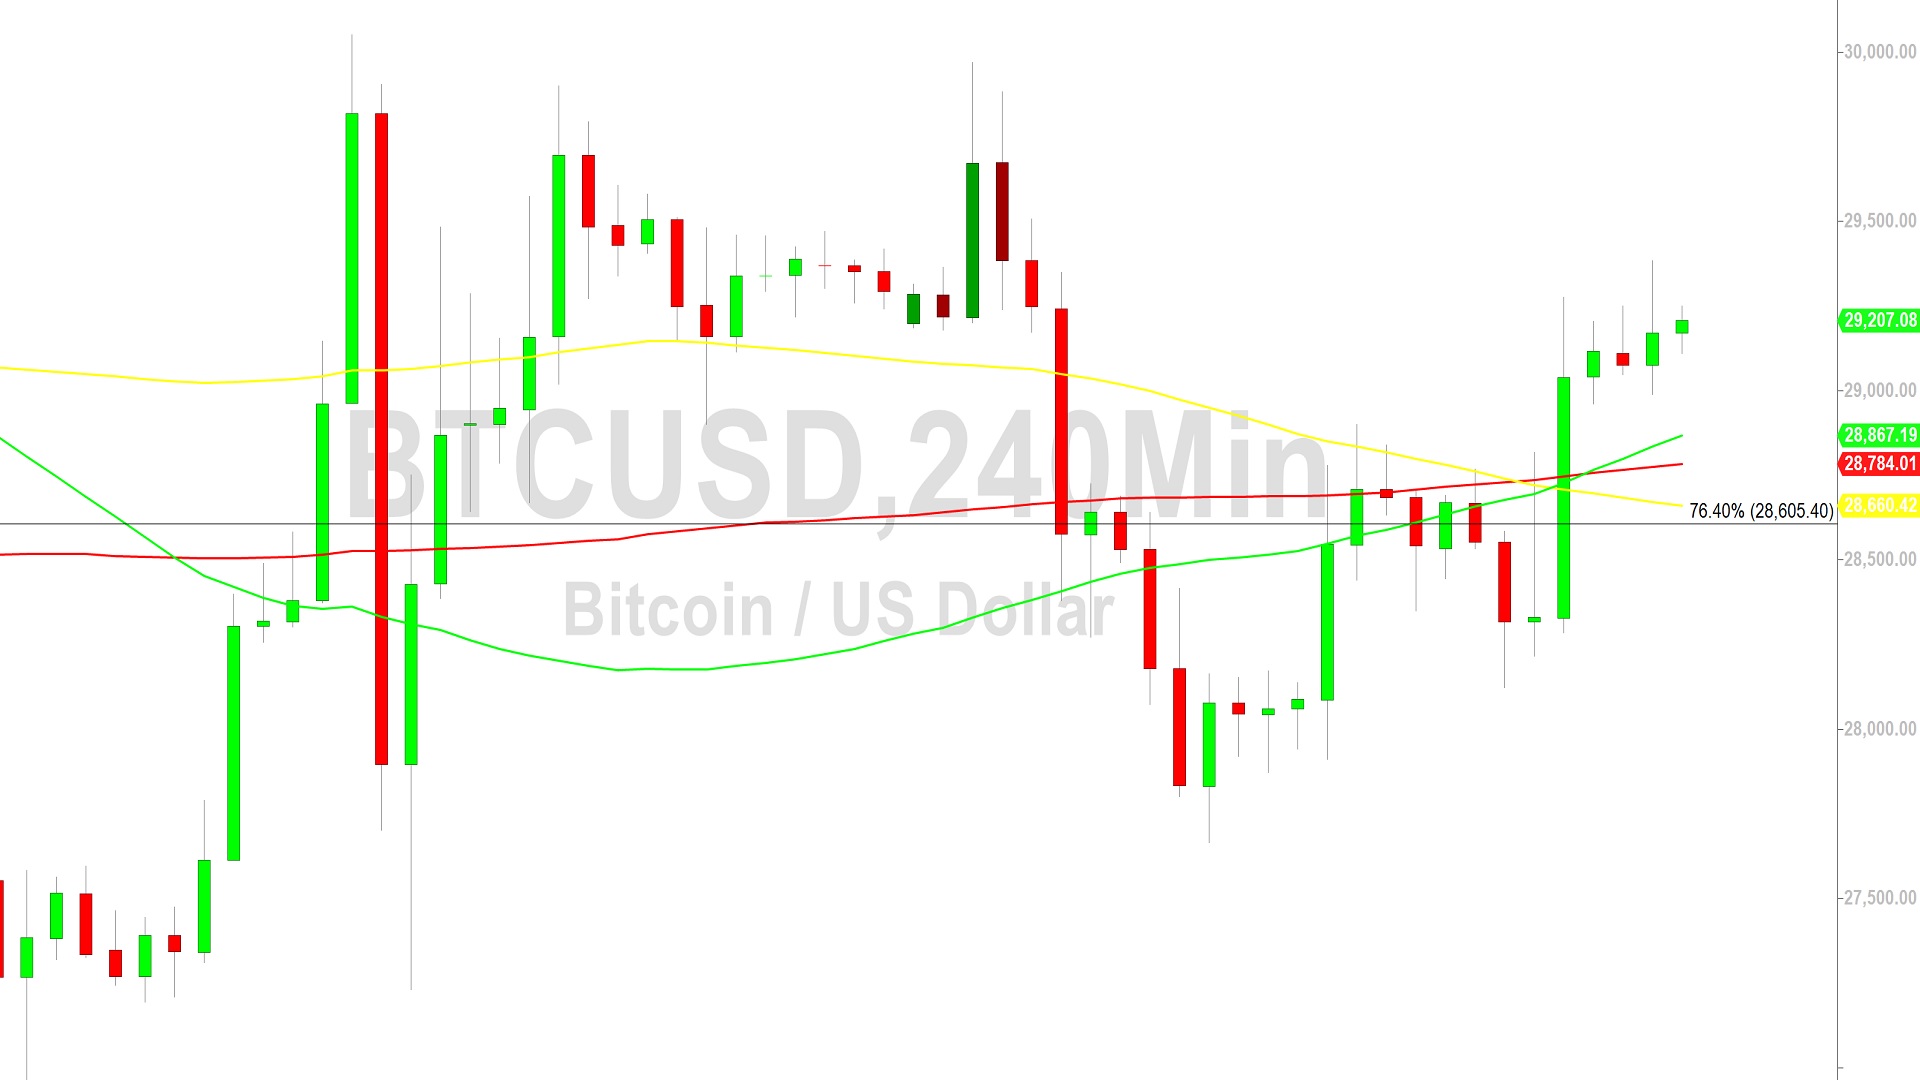
BTC/USD Tests 29370 After Surge: Sally Ho’s Technical Analysis – 5 May 2023
Bitcoin (BTC/USD) sought to add to recent gains early in the Asian session as the pair extended recent gains to the 29383.50 area, representing a test of an upside price objective associated with buying pressure that strengthened around the 27479.93 area in late April. Strong bids recently emerged at the 28122 area, right around the 61.8% retracement of the recent appreciating range from 27664.31 to 28899.99. Stops were elected above the 28817.15 and 29089.22 levels during the climb, representing the 50% and 61.8% retracements of the depreciating range from 29969.99 to 27664.31. Stops were also recently elected above the 27929.17, 28525.56, 29007.57, and 29489.58 areas during the appreciation higher, retracement levels associated with the recent depreciating range from 31050 to 26965.14.
Above the market, upside price objectives relate to recent buying pressure around the 27194.51 and 28161.74 areas include the 30420.74, 31237.11, and 32556.73 levels. Downside price objectives related to recent depreciating ranges and levels include the 26533, 26085, 25604, and 24103 levels. Additional upside price objectives include the 31477.37, 32501.23, 32989.19, 34583.96, 34658.69, 35222.66, 37765.28, and 38403.97 levels. Another important price objective is the 31846.88 area, a level that represents the 50% retracement of the depreciating range from 48233.76 to 15460. Traders are observing that the 50-bar MA (4-hourly) is bullishly indicating above the 100-bar MA (4-hourly) and above the 200-bar MA (4-hourly). Also, the 50-bar MA (hourly) is bearishly indicating below the 200-bar MA (hourly) and above the 100-bar MA (hourly).
Price activity is nearest the 50-bar MA (4-hourly) at 28867.07 and the 200-bar MA (Hourly) at 28869.67.
Technical Support is expected around 26533.04/ 25604.51/ 25094.62 with Stops expected below.
Technical Resistance is expected around 31986.16/ 32989.19/ 34658.69 with Stops expected above.
On 4-Hourly chart, SlowK is Bearishly below SlowD while MACD is Bullishly above MACDAverage.
On 60-minute chart, SlowK is Bearishly below SlowD while MACD is Bullishly above MACDAverage.
Disclaimer: Sally Ho’s Technical Analysis is provided by a third party, and for informational purposes only. It does not reflect the views of Crypto Daily, nor is it intended to be used as legal, tax, investment, or financial advice.
Investment DisclaimerBitcoin upcoming monthly close will be crucial
Bitcoin suffering down week - macro picture uncertain